Unlock a world of possibilities! Login now and discover the exclusive benefits awaiting you.
- Qlik Community
- :
- All Forums
- :
- QlikView App Dev
- :
- Dyanamic chart for each product type selected(sale...
- Subscribe to RSS Feed
- Mark Topic as New
- Mark Topic as Read
- Float this Topic for Current User
- Bookmark
- Subscribe
- Mute
- Printer Friendly Page
- Mark as New
- Bookmark
- Subscribe
- Mute
- Subscribe to RSS Feed
- Permalink
- Report Inappropriate Content
Dyanamic chart for each product type selected(sales progress by date)
Dear All,
Please share your thoughts on below requirement.
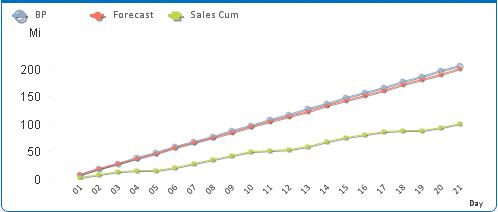
we have a chart with x axis as Day and Y axis as Sales. we dispaly always one month data.
My requirement is we have list box product. If user selects 2 products from list box, I have to show 2 charts (1 chart for 1 Product ).
Likewise I have to render charts based on how many products users can select.
For this requirement , I have tried with Trellis chart as Product type as Trellis dimension. Since Scale in Trellis chart is static , this is not much useful approach for me.
Other way is , I can pre built the chart for each product separately and render based on selection. But my Product types are not static. some products may vary for each month. Please find my chart below.
Many Many thanks for your time and help in advance.
Please share your ideas, what can be a better approach for this kind of requiremt..
BR,
Chinna.
- Tags:
- dynamic chart
Accepted Solutions
- Mark as New
- Bookmark
- Subscribe
- Mute
- Subscribe to RSS Feed
- Permalink
- Report Inappropriate Content
Dear All,
Finally I have figured out how we can make this possible. Sharing the document it may be useful for others .
Br,
Chinna
- Mark as New
- Bookmark
- Subscribe
- Mute
- Subscribe to RSS Feed
- Permalink
- Report Inappropriate Content
Dear All,
Any suggestions?
It can't possible in Qlikview?
This is done in Cognos using Repeater table..Want to migrate tht report to Qlikview from Cognos.
Please share any thoughts on the approach.
BR,
Chinna
- Mark as New
- Bookmark
- Subscribe
- Mute
- Subscribe to RSS Feed
- Permalink
- Report Inappropriate Content
Hi Chinna,
Did you able to achieve this scenario?
Please let us know. Thank you.
- Mark as New
- Bookmark
- Subscribe
- Mute
- Subscribe to RSS Feed
- Permalink
- Report Inappropriate Content
Dear All,
Finally I have figured out how we can make this possible. Sharing the document it may be useful for others .
Br,
Chinna
- Mark as New
- Bookmark
- Subscribe
- Mute
- Subscribe to RSS Feed
- Permalink
- Report Inappropriate Content
Hi Chinna,
Happy to hear.
Please share asap.
- Mark as New
- Bookmark
- Subscribe
- Mute
- Subscribe to RSS Feed
- Permalink
- Report Inappropriate Content
Thanks for sharing your solution! I like what you did.
- Mark as New
- Bookmark
- Subscribe
- Mute
- Subscribe to RSS Feed
- Permalink
- Report Inappropriate Content
Hi..Later I came to know a easy way using subfield... PFA..more useful.. BR, Chinna