Unlock a world of possibilities! Login now and discover the exclusive benefits awaiting you.
- Qlik Community
- :
- All Forums
- :
- QlikView App Dev
- :
- Re: Help with dynamic Cross table using Pivot/Stra...
- Subscribe to RSS Feed
- Mark Topic as New
- Mark Topic as Read
- Float this Topic for Current User
- Bookmark
- Subscribe
- Mute
- Printer Friendly Page
- Mark as New
- Bookmark
- Subscribe
- Mute
- Subscribe to RSS Feed
- Permalink
- Report Inappropriate Content
Help with dynamic Cross table using Pivot/Straight table
hello everyone..
I am facing a problem..
What I want is to create a dynamic cross table using straight table or Pivot table in Qlikview..
It goes lyk dis:
----Current Period---- -----------Previous Period------------
Sep-13 Sep-12 Mar13-Sep-13 Mar-12-Sep13
Cost Price 100 150 3000 3250
Selling Price 120 200 4200 5000
Profit 20 50 1200 1750
Here, the values :
1. sep-13 is the max(MonthYear) i.e the current month
2. Sep-12 is the max(MonthYear)-12 i.e same month last year
3. Mar-13 - Sep-13 is the last six MonthYear period
4. Mar-12 - Sep-12 is the last six months period for the last year.
what i wanna say is, the dimensions are calculated. i.e. all these four values will be coming from different expression but I want them to be displayed in a single header row.
Please help..
Thanks
- Mark as New
- Bookmark
- Subscribe
- Mute
- Subscribe to RSS Feed
- Permalink
- Report Inappropriate Content
Hi
use the pivote table
drag expressions and drop into vertically
let me know is it working or not
other wise give sample qvw.
- Mark as New
- Bookmark
- Subscribe
- Mute
- Subscribe to RSS Feed
- Permalink
- Report Inappropriate Content
Hi,
Can you attach sample file?
Regards,
Jagan.
- Mark as New
- Bookmark
- Subscribe
- Mute
- Subscribe to RSS Feed
- Permalink
- Report Inappropriate Content
hi..
I am attaching a screenshot of the required output...
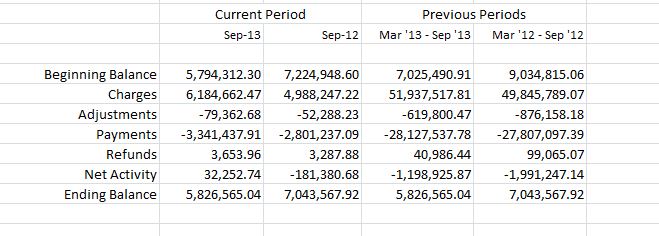
Plz try and guide me here only..As I am using the personal edition of Qlikview, I wont be able to access the .qvw file if you send one....
Thanks
- Mark as New
- Bookmark
- Subscribe
- Mute
- Subscribe to RSS Feed
- Permalink
- Report Inappropriate Content
I would like to highlight that I have the following fields:
1. Date
2. Month
3.Year
4. MonthYear
5. Charges
6. Payments
7. Adjustments
8. Refunds
The metric 'Beginning Balance' is the running sum of all the transactions from the beginning till the start of the current month.
Also Net Activity is the sum of the transaction for this month
Adding Net Activity to the Beginning Balance gives the Ending Balance.
What I want is to have the current month i.e Sep-13, same month last year i.i Sep-12 etc as the dimension which have been dragged above. And the sum(Charges) as Charges etc.. as Expressions