Unlock a world of possibilities! Login now and discover the exclusive benefits awaiting you.
- Qlik Community
- :
- All Forums
- :
- QlikView App Dev
- :
- Hide 2 of 3 expression label(s) on stacked barchar...
- Subscribe to RSS Feed
- Mark Topic as New
- Mark Topic as Read
- Float this Topic for Current User
- Bookmark
- Subscribe
- Mute
- Printer Friendly Page
- Mark as New
- Bookmark
- Subscribe
- Mute
- Subscribe to RSS Feed
- Permalink
- Report Inappropriate Content
Hide 2 of 3 expression label(s) on stacked barchart
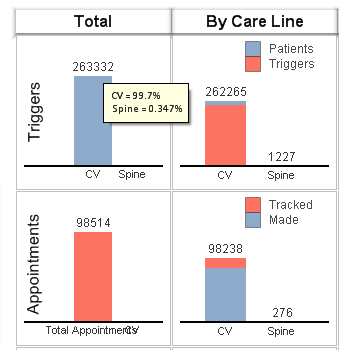
The following chart below has 3 expressions, two which calculate a percentage which totals 100%. There are two bars as a stacked chart which display without value points but have a popup label that must display to show the values. The third value is a total number not as a percentage, which has no bar but displays the value point. There are no dimensions so i'm not given an option to hide the axis.
The legend is hidden, which I believe is causing the expressions to display below the axis. I've attempted to label the expressions with a space " " or double " ", but I need the pop-up label to display. I've also attempted to change the axis text to transparent, but it doesn't allow for me to do it on 2 of the 3 fields, it does it on all three.
The expression labels for the Triggers bar are:
- CV
- Spine
- Total Triggers
All I'd like to display on the axis for an expression label is Total Triggers. If i promote Total Triggers to the top it shows up like the bar on total appointments. Any other ideas?
- Mark as New
- Bookmark
- Subscribe
- Mute
- Subscribe to RSS Feed
- Permalink
- Report Inappropriate Content
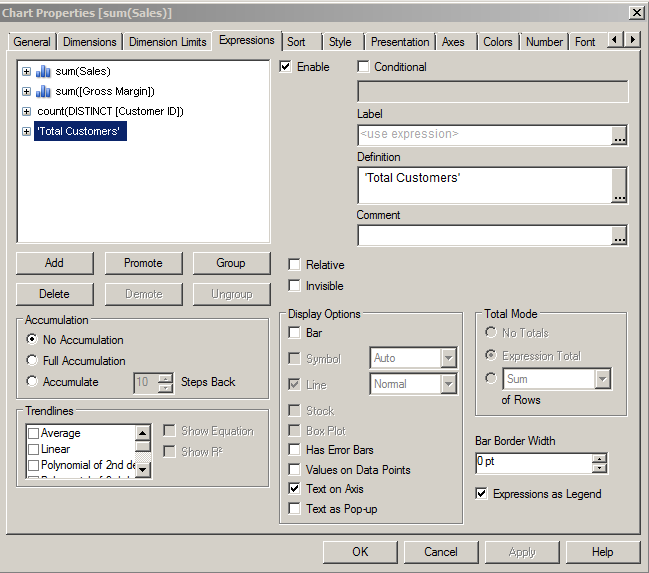
does this help ?
- Mark as New
- Bookmark
- Subscribe
- Mute
- Subscribe to RSS Feed
- Permalink
- Report Inappropriate Content
No because once you turn off show legend in presentation it will bring the expressions to the axis below
- Mark as New
- Bookmark
- Subscribe
- Mute
- Subscribe to RSS Feed
- Permalink
- Report Inappropriate Content
Actually your response of using text on axis did help. I was able to set the font to transparent on the axis and text on appeared on top with the axis transparent. It's sloppy but it works.
- Mark as New
- Bookmark
- Subscribe
- Mute
- Subscribe to RSS Feed
- Permalink
- Report Inappropriate Content
cool . Sorry for not reading your requirements in full.
one extra point which may not have been obvious.... I noticed the label was kind of hard to read (the 'text on axis' label) . Not shown in the screenshot was that i expanded the expression and changed the 'text color' to black() and the 'text style' to '<B>' which means bold.
thanks again.
- Mark as New
- Bookmark
- Subscribe
- Mute
- Subscribe to RSS Feed
- Permalink
- Report Inappropriate Content
Yes, good point, the text on axis is grayed out, so you can either use black() or =RGB(0,0,0) for the text color.