Unlock a world of possibilities! Login now and discover the exclusive benefits awaiting you.
- Qlik Community
- :
- All Forums
- :
- QlikView App Dev
- :
- How to Implement Heat Map on Qliksense
- Subscribe to RSS Feed
- Mark Topic as New
- Mark Topic as Read
- Float this Topic for Current User
- Bookmark
- Subscribe
- Mute
- Printer Friendly Page
- Mark as New
- Bookmark
- Subscribe
- Mute
- Subscribe to RSS Feed
- Permalink
- Report Inappropriate Content
How to Implement Heat Map on Qliksense
Good day everyone,
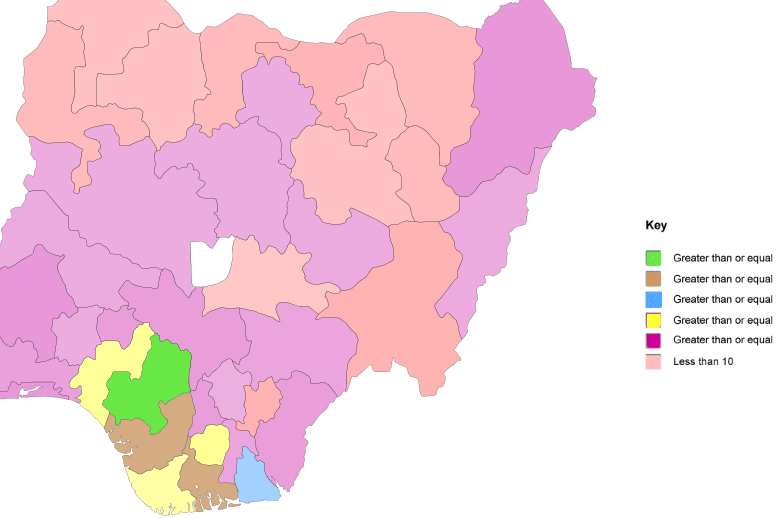
I need to develop a heat map on qliksense using the Nigeria map as the map as well as showing all the states in the map.
The state area on the map will be used as the dimension against total number of students.
Can anyone help me with the clue..
Although I have done a heat map using xml.code... but how can I do that for Nigeria.
See attached for desired map (Nigeria)..
Regards
Accepted Solutions
- Mark as New
- Bookmark
- Subscribe
- Mute
- Subscribe to RSS Feed
- Permalink
- Report Inappropriate Content
1. Download a KML file for Nigeria States. For example, from here Download | Global Administrative Areas.I used the "Level 1" data for this example. Files downloaded from this site are in archive format and will need to be unzipped using a tool like 7Zip.
2. Drag the extracted KML file to your Qlik Sense application.
3. Load your student data, using the same name for the state that the KML load used. In this example, [NGA_adm1.Name]. (Note: you can modify the KML load to use a fieldname you are already using like "State").
4. Create a Map object in your Qlik Sense app. Use [NGA_adm1.Name] for the Dimension. Select "Area" when prompted.
5. In the Appearance section of the map properties, provide your Student aggregation (like "Sum(Students)") as the color by expression and select a color scheme.

That's it. You have some options to mess with as far as color schemes and how you want the Students to be bucketed or not. Example qvf attached.

-Rob
- Mark as New
- Bookmark
- Subscribe
- Mute
- Subscribe to RSS Feed
- Permalink
- Report Inappropriate Content
Hi,
maybe helpful:

regards
Marco
- Mark as New
- Bookmark
- Subscribe
- Mute
- Subscribe to RSS Feed
- Permalink
- Report Inappropriate Content
1. Download a KML file for Nigeria States. For example, from here Download | Global Administrative Areas.I used the "Level 1" data for this example. Files downloaded from this site are in archive format and will need to be unzipped using a tool like 7Zip.
2. Drag the extracted KML file to your Qlik Sense application.
3. Load your student data, using the same name for the state that the KML load used. In this example, [NGA_adm1.Name]. (Note: you can modify the KML load to use a fieldname you are already using like "State").
4. Create a Map object in your Qlik Sense app. Use [NGA_adm1.Name] for the Dimension. Select "Area" when prompted.
5. In the Appearance section of the map properties, provide your Student aggregation (like "Sum(Students)") as the color by expression and select a color scheme.
That's it. You have some options to mess with as far as color schemes and how you want the Students to be bucketed or not. Example qvf attached.
-Rob
- Mark as New
- Bookmark
- Subscribe
- Mute
- Subscribe to RSS Feed
- Permalink
- Report Inappropriate Content
Please close this thread if your question is answered:
Qlik Community Tip: Marking Replies as Correct or Helpful
thanks
regards
Marco