Unlock a world of possibilities! Login now and discover the exclusive benefits awaiting you.
- Qlik Community
- :
- All Forums
- :
- QlikView App Dev
- :
- How to show each value with Bar in Bar chart
- Subscribe to RSS Feed
- Mark Topic as New
- Mark Topic as Read
- Float this Topic for Current User
- Bookmark
- Subscribe
- Mute
- Printer Friendly Page
- Mark as New
- Bookmark
- Subscribe
- Mute
- Subscribe to RSS Feed
- Permalink
- Report Inappropriate Content
How to show each value with Bar in Bar chart
Hello Experts,
Iam using the data is in below attached manner.Here i want show the value of Cycle column in Y-axis ,Subject_area in X-axis
and the column of completion_status is shown with bars if Yes means Green,No means Red using the Cycle values.
Thanks in advanced.
- « Previous Replies
-
- 1
- 2
- Next Replies »
Accepted Solutions
- Mark as New
- Bookmark
- Subscribe
- Mute
- Subscribe to RSS Feed
- Permalink
- Report Inappropriate Content
Hi,
Then add cycle in dimension.
Also if this dont solve your problem, please attach sample output.
- Mark as New
- Bookmark
- Subscribe
- Mute
- Subscribe to RSS Feed
- Permalink
- Report Inappropriate Content
Hi,
You can use stack bar chart layout with background color expression to color the stacked bars and use expression like
count({<completion_status={"Yes"}>}completion_status) for each expr and Use values on data point in the expression tab for each expression, and plot values inside segments on presentation tab.
Regards
Miskin
- Mark as New
- Bookmark
- Subscribe
- Mute
- Subscribe to RSS Feed
- Permalink
- Report Inappropriate Content
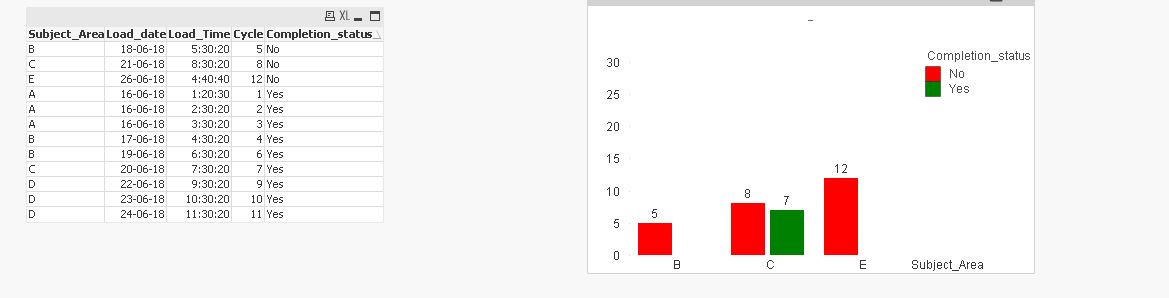
Thanks.
This is my output,but some subject area values are not shown.
- Mark as New
- Bookmark
- Subscribe
- Mute
- Subscribe to RSS Feed
- Permalink
- Report Inappropriate Content
Hi,
Can you show me your expression... Also try to use
Capitalize(trim(Completion_status)) in backend to remove unwanted space.
let me know if your problem still persist....
- Mark as New
- Bookmark
- Subscribe
- Mute
- Subscribe to RSS Feed
- Permalink
- Report Inappropriate Content
Unwanted space is not available in my data,but show bar chart with using cycle values on Y-axis ,subject _area in x-axis and show the Completion_status Green & Red of Yes /No
- Mark as New
- Bookmark
- Subscribe
- Mute
- Subscribe to RSS Feed
- Permalink
- Report Inappropriate Content
Hi,
Can you attached app to debug why this is not working....
- Mark as New
- Bookmark
- Subscribe
- Mute
- Subscribe to RSS Feed
- Permalink
- Report Inappropriate Content
Hi,
Iam using normal version.I got at last output is below manner.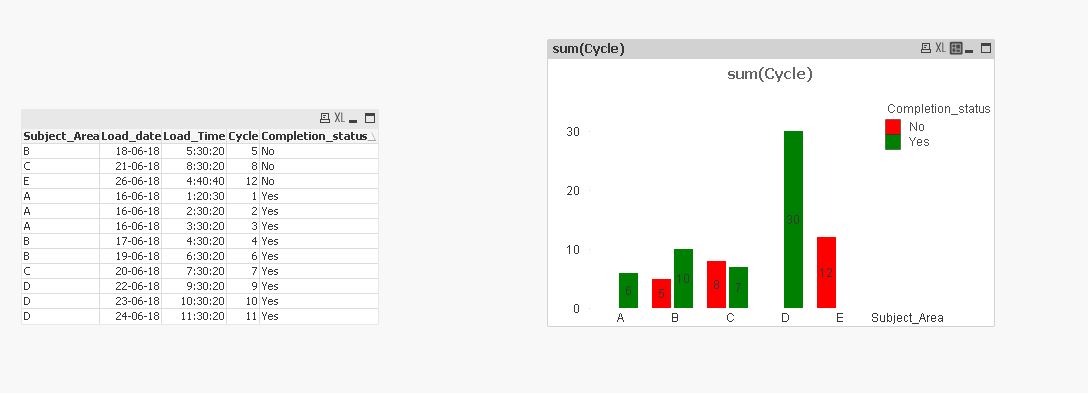
But i want to show values individually.
- Mark as New
- Bookmark
- Subscribe
- Mute
- Subscribe to RSS Feed
- Permalink
- Report Inappropriate Content
Hi,
What do you mean by show values individually??? in bar chart or in straight table and which values
- Mark as New
- Bookmark
- Subscribe
- Mute
- Subscribe to RSS Feed
- Permalink
- Report Inappropriate Content
Hi,
Thanks for giving suggestion.
I meant that each value of cycle is shown in bar.
(i,e. A 5 Yes
A 6 Yes
B 7 Yes
B 5 No
C 2 Yes)
It is not shown the values by combing the A 11,Green.It is show A 5 Green,A 6 Green.So on
- Mark as New
- Bookmark
- Subscribe
- Mute
- Subscribe to RSS Feed
- Permalink
- Report Inappropriate Content
Hi,
As mentioned earlier, under style tab please select Stacked as subtype...
- « Previous Replies
-
- 1
- 2
- Next Replies »