Unlock a world of possibilities! Login now and discover the exclusive benefits awaiting you.
- Qlik Community
- :
- All Forums
- :
- QlikView App Dev
- :
- Incremental Percentage Monthwise
- Subscribe to RSS Feed
- Mark Topic as New
- Mark Topic as Read
- Float this Topic for Current User
- Bookmark
- Subscribe
- Mute
- Printer Friendly Page
- Mark as New
- Bookmark
- Subscribe
- Mute
- Subscribe to RSS Feed
- Permalink
- Report Inappropriate Content
Incremental Percentage Monthwise
Hi Everyone,
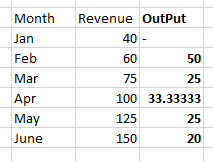
I have a requirement to show the monthly incremental percentage of Revenue. Here i have created a concatenated field with Year &'-' & Month as a dimension. Please tell me how can i show the monthly incremental percentage as shown in excel & image..
Accepted Solutions
- Mark as New
- Bookmark
- Subscribe
- Mute
- Subscribe to RSS Feed
- Permalink
- Report Inappropriate Content
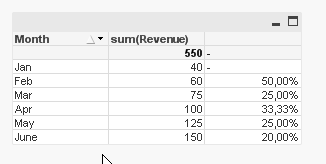
In the straight table chart use
Dimension:- Year &'-' & Month
Expression1:- sum(Revenue)
Expression2:- (sum(Revenue) - above( sum(Revenue)) ) * 100 / above( sum(Revenue))
Note:- in the sort properties select the Year &'-' & Month and only select Load Order this will done in the front end level only you can achieve this in the script level also.
Regards,
Anand
- Mark as New
- Bookmark
- Subscribe
- Mute
- Subscribe to RSS Feed
- Permalink
- Report Inappropriate Content
see attachment
- Mark as New
- Bookmark
- Subscribe
- Mute
- Subscribe to RSS Feed
- Permalink
- Report Inappropriate Content
In the load script you can achieve this by the below code
Data:
LOAD * Inline
[
Month, Revenue, OutPut
Jan, 40, -
Feb, 60, 50
Mar, 75, 25
Apr, 100, 33.33333333
May, 125, 25
June, 150, 20
];
NewTable:
LOAD
Month,
Revenue as Rev,
( Revenue - Previous(Revenue) ) * 100 / Previous(Revenue) as PrevRevenue
Resident Data;
And in chart take Dimension and Expression
Dimension:- Year &'-' & Month
Expression1:- sum(Revenue)
Expression2:- sum(PrevRevenue)
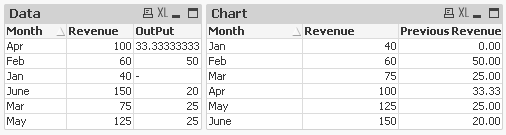
Note:- In the sort properties select the Year &'-' & Month and only select Load Order.
Regards,
Anand