Unlock a world of possibilities! Login now and discover the exclusive benefits awaiting you.
Announcements
Qlik Community Office Hours - Bring your Ideation questions- May 15th, 11 AM ET:
REGISTER NOW
- Qlik Community
- :
- All Forums
- :
- QlikView App Dev
- :
- Merge Column Header in Charts/tables
Options
- Subscribe to RSS Feed
- Mark Topic as New
- Mark Topic as Read
- Float this Topic for Current User
- Bookmark
- Subscribe
- Mute
- Printer Friendly Page
Turn on suggestions
Auto-suggest helps you quickly narrow down your search results by suggesting possible matches as you type.
Showing results for
Contributor III
2017-11-14
04:09 AM
- Mark as New
- Bookmark
- Subscribe
- Mute
- Subscribe to RSS Feed
- Permalink
- Report Inappropriate Content
Merge Column Header in Charts/tables
I have a pivot table which looks somewhat like this:
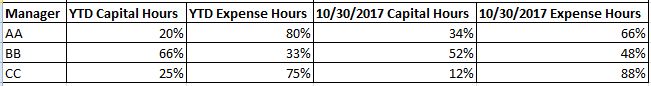
(illustration from excel)
I want 'YTD' and '10/30/2017' to be merged for capital and expense hours.
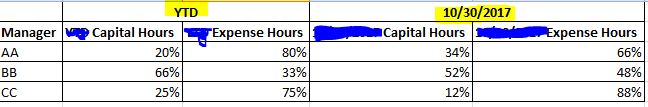
I cannot put a label on top of the expressions because it is a pivot table so the size of the table is not fixed. Also I add (with a load * inline) new dimension and then drag it over the expressions horizontally because YTD and Last Week (10/30/2017 in this example) are 4 different expressions. So if I drag YTD over the expression, it will appear over both the yearly and weekly expressions.
Is there any way to achieve what I have shown in this snapshot above?
Thanks,
YASH
399 Views
0 Replies