Unlock a world of possibilities! Login now and discover the exclusive benefits awaiting you.
- Qlik Community
- :
- All Forums
- :
- QlikView App Dev
- :
- Straight table vs table box
- Subscribe to RSS Feed
- Mark Topic as New
- Mark Topic as Read
- Float this Topic for Current User
- Bookmark
- Subscribe
- Mute
- Printer Friendly Page
- Mark as New
- Bookmark
- Subscribe
- Mute
- Subscribe to RSS Feed
- Permalink
- Report Inappropriate Content
Straight table vs table box
Hi all,
I have to show few transactions as a straight table with totals.
my data is as below:
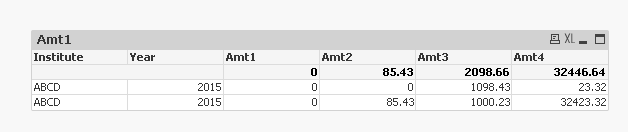
Institute Year Amt1 Amt2 Amt3 Amt4
ABCD 2015 0.00 85.43 1000.23 32423.32
ABCD 2015 0.00 0.00 1098.43 23.32
I do not want to sum these up but I need totals at the top. When I show this data in straight table by putting these amount field names as expressions nothing comes up. When I use a table box I can see detail transactions but I am not able to show a total there? Any help why this problem with Straight table? Please find my test application attached.
Thanks in advance.
- « Previous Replies
-
- 1
- 2
- Next Replies »
Accepted Solutions
- Mark as New
- Bookmark
- Subscribe
- Mute
- Subscribe to RSS Feed
- Permalink
- Report Inappropriate Content
Use attached example. AGGR will be expensive to calculate on large data sets. If it is Straight table use the logic of hiding dimensions.
- Mark as New
- Bookmark
- Subscribe
- Mute
- Subscribe to RSS Feed
- Permalink
- Report Inappropriate Content
Use Institute and year as dimension,
Amt1 Amt2 Amt3 Amt4 as expression but using
Sum(Amt1) for expr.1
Sum(Amt2) for expr.2
....
- Mark as New
- Bookmark
- Subscribe
- Mute
- Subscribe to RSS Feed
- Permalink
- Report Inappropriate Content
You need to use an aggregation function in your chart expressions.
Something like
=sum(amt2)
- Mark as New
- Bookmark
- Subscribe
- Mute
- Subscribe to RSS Feed
- Permalink
- Report Inappropriate Content
This?
If yes then PFA
Best,
Sunny
- Mark as New
- Bookmark
- Subscribe
- Mute
- Subscribe to RSS Feed
- Permalink
- Report Inappropriate Content
Thank you for the replies!
I do not want to sum them up. I need to show every transaction as it looks in the table box with totals. Is this possible with a straight table?
- Mark as New
- Bookmark
- Subscribe
- Mute
- Subscribe to RSS Feed
- Permalink
- Report Inappropriate Content
This?

- Mark as New
- Bookmark
- Subscribe
- Mute
- Subscribe to RSS Feed
- Permalink
- Report Inappropriate Content
Use attached example. AGGR will be expensive to calculate on large data sets. If it is Straight table use the logic of hiding dimensions.
- Mark as New
- Bookmark
- Subscribe
- Mute
- Subscribe to RSS Feed
- Permalink
- Report Inappropriate Content
Thank you.But I would need totals too
- Mark as New
- Bookmark
- Subscribe
- Mute
- Subscribe to RSS Feed
- Permalink
- Report Inappropriate Content
The table box will not show every transaction, just unique combinations of your fields.
If you want to show every transaction, add a key to your table:
LOAD Institute,
Year,
amt1,
amt2,
amt3,
amt4,
recno() as TransID
FROM
MAS.xls
(biff, embedded labels, table is [Sheet 1$]);
Add this key to your table chart (as dimension) / table box and for the table chart, use sum(FIELD) as expression.
- Mark as New
- Bookmark
- Subscribe
- Mute
- Subscribe to RSS Feed
- Permalink
- Report Inappropriate Content
Sum of a single number is the number without a sum - so what is the problem? For you to get a total you need to specify a sum.
It is possible to write the field name without a sum but then you have to write an if to check whether the row you are on is the total (sum) row and then perform a sum anyway... The approach Alessandro is the best in fact.
You could however write:
If ( RowNo() = 0 , Sum( Amt1 ) , Amt1 )
If the Institute and Year doesnt give you a single value then this formula will give a null in the corresponding row...
- « Previous Replies
-
- 1
- 2
- Next Replies »