Unlock a world of possibilities! Login now and discover the exclusive benefits awaiting you.
- Qlik Community
- :
- All Forums
- :
- QlikView App Dev
- :
- how to color text of a dimension of a bar chart
- Subscribe to RSS Feed
- Mark Topic as New
- Mark Topic as Read
- Float this Topic for Current User
- Bookmark
- Subscribe
- Mute
- Printer Friendly Page
- Mark as New
- Bookmark
- Subscribe
- Mute
- Subscribe to RSS Feed
- Permalink
- Report Inappropriate Content
how to color text of a dimension of a bar chart
Hello
I got a bar chart
it has a dimension called the release that has values v3.1.26, v3.1.27 tilll v3.1.31
I want to color these labels as follows:
v3.1.26 color(1)
v3.1.27 color(2)
and so on...
I went to axes tab and clicked on the font button insdie the dimension axis
and put the following expression Color(mid(Dim1,6,2)-(26-1))
however I only get black colored labels
Please advise
- « Previous Replies
-
- 1
- 2
- Next Replies »
- Mark as New
- Bookmark
- Subscribe
- Mute
- Subscribe to RSS Feed
- Permalink
- Report Inappropriate Content
The parentheses don't match. Perhaps you forgot a closing parenthesis at the end of the expression.
talk is cheap, supply exceeds demand
- Mark as New
- Bookmark
- Subscribe
- Mute
- Subscribe to RSS Feed
- Permalink
- Report Inappropriate Content
I added the missing parenthesis and still doesn't work
- Mark as New
- Bookmark
- Subscribe
- Mute
- Subscribe to RSS Feed
- Permalink
- Report Inappropriate Content
Axis Font colors are not calculated on a Dimension basis. It is calculated once for the chart outside the Dimensional context. So you can't vary the colors by Axis value.
-Rob
- Mark as New
- Bookmark
- Subscribe
- Mute
- Subscribe to RSS Feed
- Permalink
- Report Inappropriate Content
why it doesn't work just as the pivot table?
- Mark as New
- Bookmark
- Subscribe
- Mute
- Subscribe to RSS Feed
- Permalink
- Report Inappropriate Content
Hi Ali,
do you want it like this?
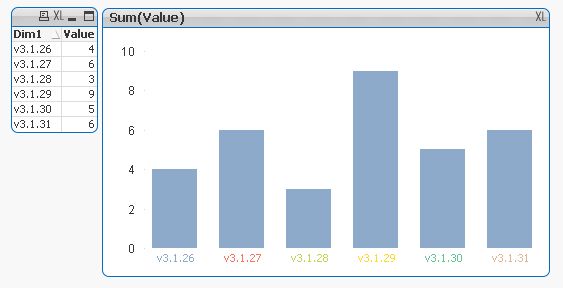
Regards
Burkhard
- Mark as New
- Bookmark
- Subscribe
- Mute
- Subscribe to RSS Feed
- Permalink
- Report Inappropriate Content
yes this is what I want
- Mark as New
- Bookmark
- Subscribe
- Mute
- Subscribe to RSS Feed
- Permalink
- Report Inappropriate Content
Hi Ali,
do it like this: add a new expression Only(dim1) and mark 'Text on Axis', but don't mark the 'Bar' check box. Also don't forget to uncheck the 'Legend' check box for your dimension dim1. See the pictures below
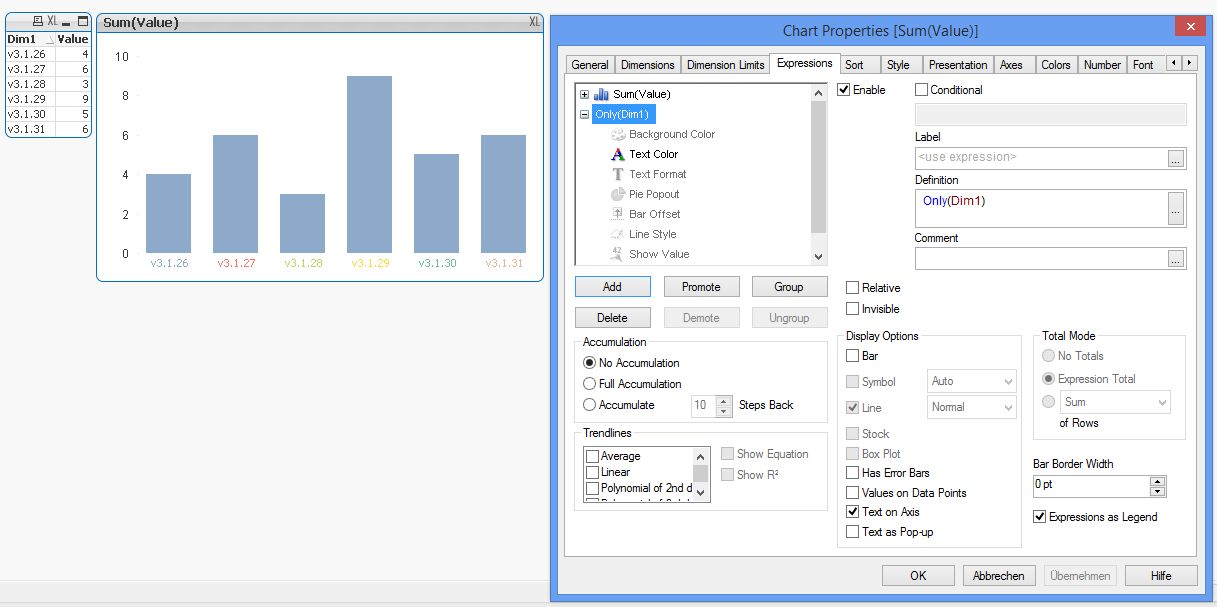

At last set your expression Color(mid(Dim1,6,2)-(26-1)) into the 'Text Color' of your Only(dim1) expression.
That's all.
Hope this helps
Burkhard
- Mark as New
- Bookmark
- Subscribe
- Mute
- Subscribe to RSS Feed
- Permalink
- Report Inappropriate Content
the problem is that I have two dimensions!!
I cannot use only(Dim1)
- Mark as New
- Bookmark
- Subscribe
- Mute
- Subscribe to RSS Feed
- Permalink
- Report Inappropriate Content
Hi Ali,
I added a second dimension and it worked same as with one dimension. See the picture:

If you still have problems to get the result, please give me your data or qvw and I try to help...
Burkhard
- « Previous Replies
-
- 1
- 2
- Next Replies »