Unlock a world of possibilities! Login now and discover the exclusive benefits awaiting you.
- Qlik Community
- :
- All Forums
- :
- QlikView App Dev
- :
- subtotal for calcuated row
- Subscribe to RSS Feed
- Mark Topic as New
- Mark Topic as Read
- Float this Topic for Current User
- Bookmark
- Subscribe
- Mute
- Printer Friendly Page
- Mark as New
- Bookmark
- Subscribe
- Mute
- Subscribe to RSS Feed
- Permalink
- Report Inappropriate Content
subtotal for calcuated row
Hi,
I have a problem with subtotal.
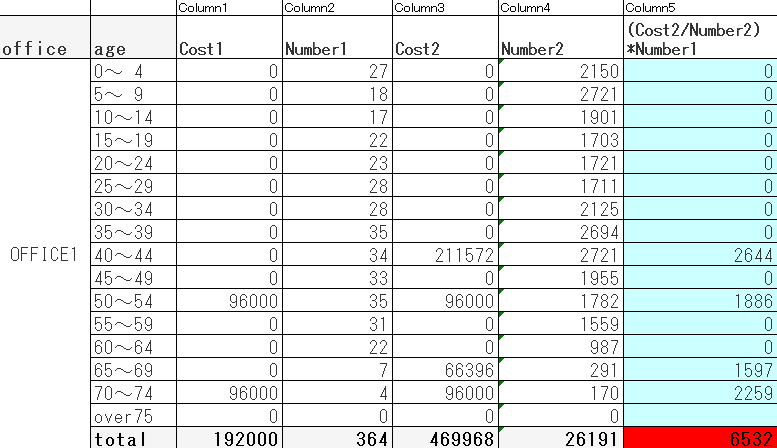
Please look at the chart below.
In this chart, I use "Show Partial Sums" to get the total of each columns.
subtotal for column1 to column4 is calculated correctly (ex. 96000+96000=192000 for column1)
but subtotl for column5 is not.
I want to sum up each rows in Column5 ([2644+1886+1597+2259=8686])
but it shows the calculated result of [(Cost2/Number2)*Number1] for total line.
How can I get the subtotal for column5?
Any help is appreciated.
Accepted Solutions
- Mark as New
- Bookmark
- Subscribe
- Mute
- Subscribe to RSS Feed
- Permalink
- Report Inappropriate Content
 Sum(Cost2/Number2* Number1). I believe this will result in the correct total in the bottom.
- Mark as New
- Bookmark
- Subscribe
- Mute
- Subscribe to RSS Feed
- Permalink
- Report Inappropriate Content
Hi Naho,
This problem occur because you are taking directly the column name in your expression.
But for getting the 'Show Partial Sum', you have to use sum in your expression.
Use this Expression,it will work out for you :
(Sum(Cost2)/Sum(Number2))* sum(Number1)
- Mark as New
- Bookmark
- Subscribe
- Mute
- Subscribe to RSS Feed
- Permalink
- Report Inappropriate Content
Sum(Cost2/Number2* Number1). I believe this will result in the correct total in the bottom.
- Mark as New
- Bookmark
- Subscribe
- Mute
- Subscribe to RSS Feed
- Permalink
- Report Inappropriate Content
Thank you for your help, Michael.
Actually, the expression in actual chart is [sum(cost2)/sum(number2)*sum(number1)].
(I just dropped 'sum' from the label.) So it's not the problem of lack of "sum".
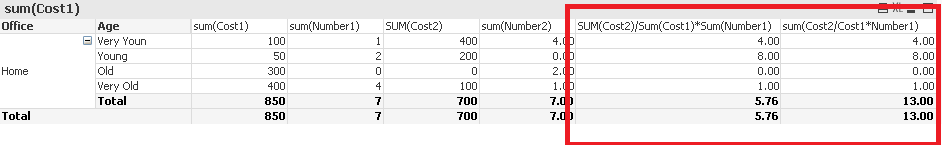
In your chart, the total for [sum(cost2)/sum(number2)*sum(number1)] is 5.76
but what I want to show is 13.00(4.00+8.00+1.00).
It's not nessesary to use "show the partial total" if I can get the subtotal correctly.
Do you have any ideas to achive this?
- Mark as New
- Bookmark
- Subscribe
- Mute
- Subscribe to RSS Feed
- Permalink
- Report Inappropriate Content
Look at the last column in the image above. It is Sum(Cost2/Number2* Number1). That will give you 13 and not 5.76. Sum(Cost2)/Sum(Number2)* sum(Number1) will yield 5.76.
Remove the extra sums and sum the entire equation.
Attached is the QVW.
- Mark as New
- Bookmark
- Subscribe
- Mute
- Subscribe to RSS Feed
- Permalink
- Report Inappropriate Content
Now I understand. Thank you very much.