Unlock a world of possibilities! Login now and discover the exclusive benefits awaiting you.
- Qlik Community
- :
- All Forums
- :
- QlikView App Dev
- :
- Re: Can't convert to percentages...
- Subscribe to RSS Feed
- Mark Topic as New
- Mark Topic as Read
- Float this Topic for Current User
- Bookmark
- Subscribe
- Mute
- Printer Friendly Page
- Mark as New
- Bookmark
- Subscribe
- Mute
- Subscribe to RSS Feed
- Permalink
- Report Inappropriate Content
Can't convert to percentages...
So I am very new to Qlikview so I apologize if this is simple.
I have a table titled DCReason that lists reasons for discharges. This information is linked to another table titled Branches (these are our office branches). I want to produce a graph that lists the discharge reasons and displays them as a percent so that when I click on a branch office, I can see what % of people were discharged for each reason.
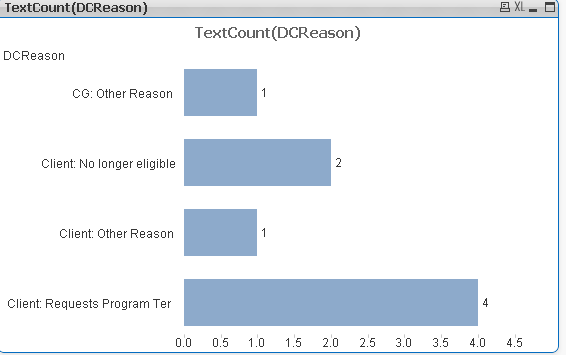
I've tried doing sum(DCReason)/sum(Total DCReason). I also tried playing around with the fractile function but nothing  . All I am able to do is produce a graph taht shows the absolute number (Textcount (DCReason))

Accepted Solutions
- Mark as New
- Bookmark
- Subscribe
- Mute
- Subscribe to RSS Feed
- Permalink
- Report Inappropriate Content
Use the 'Table Viewer' to see how the 2 tables are inter-connected.
Ideally the formula Count(DCreasons)/Count(TOTAL DCreasons) should give you a percent.
- Mark as New
- Bookmark
- Subscribe
- Mute
- Subscribe to RSS Feed
- Permalink
- Report Inappropriate Content
Mmh I think there's something wrong in the model. Are you sure you have to tables? If yes, you should have a Value field where it says the number of time a particular reason happened. Youshould sum that fieldn instead of the Reason description. I guess you should have something like:
| Branch | Reason |
|---|---|
| idBranch | idBranch |
| Branch Description | IdReason |
| Reason Description |
youshould do count(idReason)/count(total idReason)
- Mark as New
- Bookmark
- Subscribe
- Mute
- Subscribe to RSS Feed
- Permalink
- Report Inappropriate Content
Yea. One table is titled DCreasons and has all the reasons (as noted above) and the other other is titled Branch and contains the name of the branches. I know they're linked because when I click on a branch, the graph that I attached changes and shows the absolute numbers.
- Mark as New
- Bookmark
- Subscribe
- Mute
- Subscribe to RSS Feed
- Permalink
- Report Inappropriate Content
Use the 'Table Viewer' to see how the 2 tables are inter-connected.
Ideally the formula Count(DCreasons)/Count(TOTAL DCreasons) should give you a percent.
- Mark as New
- Bookmark
- Subscribe
- Mute
- Subscribe to RSS Feed
- Permalink
- Report Inappropriate Content
That expression worked! Thank you very much. I guess my problem was using textcount instead of count.
