Unlock a world of possibilities! Login now and discover the exclusive benefits awaiting you.
- Qlik Community
- :
- All Forums
- :
- QlikView App Dev
- :
- Count of times expression is within a range
- Subscribe to RSS Feed
- Mark Topic as New
- Mark Topic as Read
- Float this Topic for Current User
- Bookmark
- Subscribe
- Mute
- Printer Friendly Page
- Mark as New
- Bookmark
- Subscribe
- Mute
- Subscribe to RSS Feed
- Permalink
- Report Inappropriate Content
Count of times expression is within a range
Hi,
I have a pivot table similar to below. Each person is given a score every week and I have the expression varX that calculates it. I show it below for clarity. I want to get a % of the scores within a performance range for each week. I will be working with four UNEVEN ranges. I tried the set analysis format below but it does not work. It returns a number but if I change the number the returned values don't change. I suspect its counting everything. Thank you in advance for any ideas.
Returns a number but changing ranges has no effect:
vTier2=Count({$<vScore={">.85<=.90"}>}Name)
| Name | Week # |
|---|---|
| Person A | varX=.75 |
| Person B | varX=.8 |
| Person C | varX=.82 |
| Person D | varX=.73 |
| Person E | varX=.91 |
| Person E | varX=.84 |
p.s. I am new to QV and find the syntax confusing with the use of single vs. double quotes and where to place symbols. So if you can explain any incorrect syntax I would appreciate it!
- « Previous Replies
- Next Replies »
- Mark as New
- Bookmark
- Subscribe
- Mute
- Subscribe to RSS Feed
- Permalink
- Report Inappropriate Content
What is vScore here? Is this a field name or is this a variable? Would you be able to post a sample qvw? For set analysis syntax you can look at this guide
- Mark as New
- Bookmark
- Subscribe
- Mute
- Subscribe to RSS Feed
- Permalink
- Report Inappropriate Content
I am sorry. I meant varX.
varX = vScore
- Mark as New
- Bookmark
- Subscribe
- Mute
- Subscribe to RSS Feed
- Permalink
- Report Inappropriate Content
Hi Sunny,
Strangely I know I replied to this but don't see it. My error. I changed the name.
varX = VScore
- Mark as New
- Bookmark
- Subscribe
- Mute
- Subscribe to RSS Feed
- Permalink
- Report Inappropriate Content
I still don't completely understand how your data is laid out. Would you be able to share screenshots, if not a sample?
- Mark as New
- Bookmark
- Subscribe
- Mute
- Subscribe to RSS Feed
- Permalink
- Report Inappropriate Content
Hi,
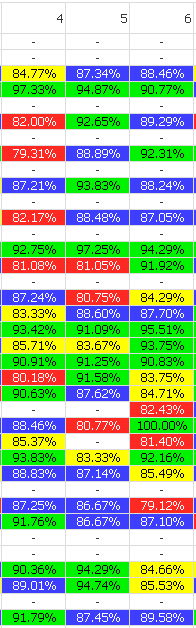
The top row are week numbers. To the left of each row of numbers would be a person's name. So "Person A" (first row) has the scores of 84.77%. 87.34%, 88.46%. My expression calculates those values in the pivot. For each column I want to calculate the % of blue, red, yellow and green cells for that column (Week).
- Mark as New
- Bookmark
- Subscribe
- Mute
- Subscribe to RSS Feed
- Permalink
- Report Inappropriate Content
you are not able to use the vScore variable that way, normally the variables that work with set analysis tend to be a fixed value and you compare a field against them
is "varX" a calculated value or a fixed value ? If it is a fixed value just use that instead of the variable and it should work, if it is a calculated, can you run that calculation in the script ?
- Mark as New
- Bookmark
- Subscribe
- Mute
- Subscribe to RSS Feed
- Permalink
- Report Inappropriate Content
Hi Ramon,
I thought that it couldn't be used that way either but I was told otherwise, so I posted. Each numbers you see in the chart is the evaluation of the expression varX which is an approval per person per week.
varX = approved/ (approved + disapproved)
I want the percentage of people who fall within an approval rating range each week (column). I've only been at this for a few weeks. I only know how to load and do some cleaning with scripts so unfortunately I couldn't tell you at this point.
- Mark as New
- Bookmark
- Subscribe
- Mute
- Subscribe to RSS Feed
- Permalink
- Report Inappropriate Content
see if this expression works, I did not test this yet, but by comparing to other expressions I have used, it should work
Count({$<Name={"=(approved/ (approved + disapproved)) >.85<=.90"}>}Name)
another option (and the one I recommend) is to create a field in the script, something like this should work
Load
*,
(approved/ (approved + disapproved)) as WeeklyRate
from ......
and then you could replace the variable with this field
- Mark as New
- Bookmark
- Subscribe
- Mute
- Subscribe to RSS Feed
- Permalink
- Report Inappropriate Content
Thanks. I will try it but I don't understand how that would work as it seems this is trying to equate names such as "Tom", "Lisa", to a numeric value range. I will substitute my variable in below as that is the equivalent.
Count({$<Name={"=varX >.85<=.90"}>}Name)
- « Previous Replies
- Next Replies »