Unlock a world of possibilities! Login now and discover the exclusive benefits awaiting you.
- Qlik Community
- :
- All Forums
- :
- QlikView App Dev
- :
- Highlight a row based on count of a field?
- Subscribe to RSS Feed
- Mark Topic as New
- Mark Topic as Read
- Float this Topic for Current User
- Bookmark
- Subscribe
- Mute
- Printer Friendly Page
- Mark as New
- Bookmark
- Subscribe
- Mute
- Subscribe to RSS Feed
- Permalink
- Report Inappropriate Content
Highlight a row based on count of a field?
Hi all,
can anyone help me with the following.
i need to display/highlight only those Name in my report where flag is gray for two consecutive months(date col).
(till now only jan, Feb data is loaded. )
| SNO | Date | Name | Flag |
| 1 | 20130117 | del | Gray |
| 2 | 20130117 | p099 | Gray |
| 3 | 20130117 | plm099 | Green |
| 4 | 20130117 | f044 | Gray |
| 5 | 20130117 | d100 | Gray |
| 6 | 20130213 | del | Gray |
| 7 | 20130213 | p099 | Gray |
| 8 | 20130213 | plm099 | Gray |
| 9 | 20130213 | f044 | Green |
| 10 | 20130213 | d100 | Gray |
thanks
Leo
Accepted Solutions
- Mark as New
- Bookmark
- Subscribe
- Mute
- Subscribe to RSS Feed
- Permalink
- Report Inappropriate Content
- Mark as New
- Bookmark
- Subscribe
- Mute
- Subscribe to RSS Feed
- Permalink
- Report Inappropriate Content
See attached example
talk is cheap, supply exceeds demand
- Mark as New
- Bookmark
- Subscribe
- Mute
- Subscribe to RSS Feed
- Permalink
- Report Inappropriate Content
- Mark as New
- Bookmark
- Subscribe
- Mute
- Subscribe to RSS Feed
- Permalink
- Report Inappropriate Content
Hi Gysbert,
thanx for you reply it was helpful. however i need some more help with a similar but more complex problem.
i recieve a excel data on monthly basis the sheet looks like the following.(only col in use are shown here)
jan data
| 20130117 | |||
| Name | Flag1 | Flag2 | Flag2 |
| del | Gray | Green | Green |
| p099 | Gray | Green | Green |
| plm099 | Green | Gray | Green |
| f044 | Green | Gray | Gray |
| d100 | Green | Gray | Green |
Feb Data
| 20130201 | |||
| Name | Flag1 | Flag2 | Flag3 |
| del | Gray | Gray | Gray |
| p099 | Gray | Gray | Gray |
| plm099 | Green | Green | Green |
| f044 | Gray | Gray | Gray |
| d100 | Gray | Green | Gray |
now i need to show only the latest in the dashboard the latest data i.e. data from feb file. But i need to highlight those flag values that are gray in both files. the dashboard op can be like
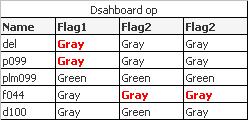
note: number of rows in each file can be more than 1000.
data is recieved monthly once
- Mark as New
- Bookmark
- Subscribe
- Mute
- Subscribe to RSS Feed
- Permalink
- Report Inappropriate Content
See attached qvw
edit: All the dimensions also have a Background Color expression defined. On the Dimension tab of the properties window click on the + sign in front of a dimension. Select Background Color and the click the Edit button.
talk is cheap, supply exceeds demand
- Mark as New
- Bookmark
- Subscribe
- Mute
- Subscribe to RSS Feed
- Permalink
- Report Inappropriate Content
Thanx 
- Mark as New
- Bookmark
- Subscribe
- Mute
- Subscribe to RSS Feed
- Permalink
- Report Inappropriate Content
Hi Gysbert,
In this solution how did you manage to highlight the whole row on the basis of one row? (Rows highlighted in green)
Leo