Unlock a world of possibilities! Login now and discover the exclusive benefits awaiting you.
- Qlik Community
- :
- All Forums
- :
- QlikView App Dev
- :
- Re: How do I create a bar chart that shows current...
- Subscribe to RSS Feed
- Mark Topic as New
- Mark Topic as Read
- Float this Topic for Current User
- Bookmark
- Subscribe
- Mute
- Printer Friendly Page
- Mark as New
- Bookmark
- Subscribe
- Mute
- Subscribe to RSS Feed
- Permalink
- Report Inappropriate Content
How do I create a bar chart that shows current month gross sales amount, orders shipped and last year same month gross sales amount and orders shipped?
I am trying to create a bar chart that shows current month gross sales amount, orders shipped and last year same month gross sales amount and orders shipped? Currently I am trying to achieve it by using this:
Gross Sales
This month:
Sum({$<[Ship Year]={$(=Year(today()))},[Ship Month]={$(=Month(today()))}>}[Gross Sales Amount])
Last Year same month:
Sum({$<[Ship Year]={$(=Year(today-1)))},[Ship Month]={$(=Month(today()))}>}[Gross Sales Amount])
Orders Shipped
(distinct if([Status]='Shipped',[Unique Order Key],null()))
The problem with those expressions is that it only lets me see the current status for February if I click on any other month the bar chart says "No Data To Display". How do I fix this?
- « Previous Replies
-
- 1
- 2
- Next Replies »
- Mark as New
- Bookmark
- Subscribe
- Mute
- Subscribe to RSS Feed
- Permalink
- Report Inappropriate Content
the following is definitely wrong as it will show your year for yesterday. Amend it as follows :
Sum({$<[Ship Year]={$(=Year(today())-1)},[Ship Month]={$(=Month(today()))}>}[Gross Sales Amount])
posting a sample application would help
- Mark as New
- Bookmark
- Subscribe
- Mute
- Subscribe to RSS Feed
- Permalink
- Report Inappropriate Content
This will happen because you have fixed the Month as February.
- Mark as New
- Bookmark
- Subscribe
- Mute
- Subscribe to RSS Feed
- Permalink
- Report Inappropriate Content
Change the set identifier from $ into 1. $ takes into account all selections, even your month selection. But that depends on where you select a month. As Ioannis suggested, it would be good to have a sample document.
Best,
Peter
- Mark as New
- Bookmark
- Subscribe
- Mute
- Subscribe to RSS Feed
- Permalink
- Report Inappropriate Content

I want the document to open up like this. For it to open with the current month selected however if I wish to see other months for example January's month sales for this year and last year it tells me "No Data to Display"
- Mark as New
- Bookmark
- Subscribe
- Mute
- Subscribe to RSS Feed
- Permalink
- Report Inappropriate Content
Ohhh ok Thanks! I am new to QlikView.
- Mark as New
- Bookmark
- Subscribe
- Mute
- Subscribe to RSS Feed
- Permalink
- Report Inappropriate Content
This can be achieved by removing Month Field from your both expressions..
Something like below...
Sum({$<[Ship Year]={'$(=Year(today()))'}>}[Gross Sales Amount])
Try this... hope it will help you.
- Mark as New
- Bookmark
- Subscribe
- Mute
- Subscribe to RSS Feed
- Permalink
- Report Inappropriate Content
It's only showing February data because you are limiting the data set with you set analysis expression i.e. sum({<...[Ship Month] = {$(=Month(Today()))}>}...
What would you like it to show when a user selects a specific month? If you want to to show the corresponding month's data, it might be better to use the Max() function in set analysis. Try replacing your Year(Today()) and Month(Today()) functions with Max([ShipYear]) and Max([Ship Month]). Now, when a user selects a month other than the most recent month, it will show that month's data.
On a side note, as Ioannis pointed out, your previous year set analysis expression needs to be corrected to [Ship Year] = {$(=Year(Today()-1))} (don't put the subtraction inside the Today() function).
- Mark as New
- Bookmark
- Subscribe
- Mute
- Subscribe to RSS Feed
- Permalink
- Report Inappropriate Content
That's something different.
Your dimension is a field containing MonthYear combinations. In every set analysis, set this field to Nothing, e.g. [Ship MonthYear] =, [Ship Year] = ...
Then replace the $(=Month(today())) part in your set analysis with the following: $(=Max([Ship Month])). Ship Month will now be set to the maximum available value from the list, instead of the fixed value of todays month.
Peter
- Mark as New
- Bookmark
- Subscribe
- Mute
- Subscribe to RSS Feed
- Permalink
- Report Inappropriate Content
*I added your expressions but I realized I need to stop fixing February. But it still doesn't do what I want.
This shows this year's current month gross sales but when I try to add last year same month it does this: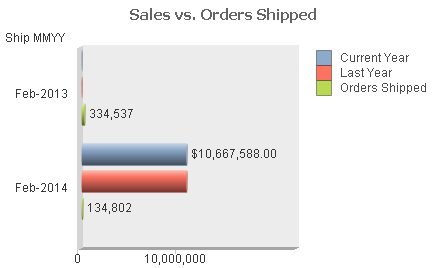
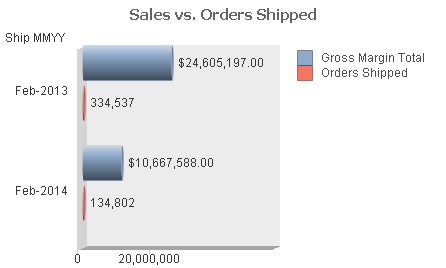
When I want it to do this:
- « Previous Replies
-
- 1
- 2
- Next Replies »