Unlock a world of possibilities! Login now and discover the exclusive benefits awaiting you.
- Qlik Community
- :
- All Forums
- :
- QlikView App Dev
- :
- Re: Pivot table calculate with hidden values
- Subscribe to RSS Feed
- Mark Topic as New
- Mark Topic as Read
- Float this Topic for Current User
- Bookmark
- Subscribe
- Mute
- Printer Friendly Page
- Mark as New
- Bookmark
- Subscribe
- Mute
- Subscribe to RSS Feed
- Permalink
- Report Inappropriate Content
Pivot table calculate with hidden values
Hi,
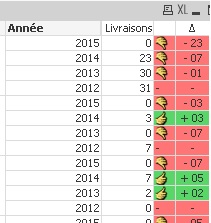
I have a pivot table with four years.
With expression i calculate sum of "Livraisons" (deliveries).
After, i calculate the difference (delta) with the year before (last column). To do this i use below() function.
It works if i don't use filters years...
Example without filters:
Now i want to filter on 2014 and 2013 :
I use Below function and the result for 2013 is I have an empty value.
How can i use below with hidden lines?

Thanx for your help.
- Mark as New
- Bookmark
- Subscribe
- Mute
- Subscribe to RSS Feed
- Permalink
- Report Inappropriate Content
The chart cannot calculate with values that are excluded from the data used in the chart. So you need to include it somehow. You can try creating a new dimension in the script that associates a year with the previous year. See this document for more information: Calculating rolling n-period totals, averages or other aggregations
talk is cheap, supply exceeds demand
- Mark as New
- Bookmark
- Subscribe
- Mute
- Subscribe to RSS Feed
- Permalink
- Report Inappropriate Content
Ok,
I want to use AsOf table.
So i created the talbe and my result is :
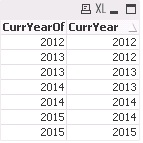
I don't know if my result is good...
What do you think?
- Mark as New
- Bookmark
- Subscribe
- Mute
- Subscribe to RSS Feed
- Permalink
- Report Inappropriate Content
I've worked all my day about this problem.
I've created the AsOf table, but i don't understand how i can use it.
In the example (link), they do a Sum but in my case, i want to substract value so, i don't understand...
Could help me more ?
- Mark as New
- Bookmark
- Subscribe
- Mute
- Subscribe to RSS Feed
- Permalink
- Report Inappropriate Content
Hello,
you can try with the logic in the qvw attached.
There are 2 variables: it seems to work, when you select couple of consecutive years, but pay attention for couple 2012-2013... I think in this precise case the output is not as you want...
But maybe it can help you.
Let me know!
BR
Elena
- Mark as New
- Bookmark
- Subscribe
- Mute
- Subscribe to RSS Feed
- Permalink
- Report Inappropriate Content
Perhaps the attached example helps.
talk is cheap, supply exceeds demand