Unlock a world of possibilities! Login now and discover the exclusive benefits awaiting you.
- Qlik Community
- :
- All Forums
- :
- QlikView App Dev
- :
- Re: Show the amount paid by all the customers on a...
- Subscribe to RSS Feed
- Mark Topic as New
- Mark Topic as Read
- Float this Topic for Current User
- Bookmark
- Subscribe
- Mute
- Printer Friendly Page
- Mark as New
- Bookmark
- Subscribe
- Mute
- Subscribe to RSS Feed
- Permalink
- Report Inappropriate Content
Show the amount paid by all the customers on a timeline by month
Hello,
I am trying to do a timeline chart, where I can show the amount left to be paid by every customer, here is a table that shows my data:
ID | Maturity Loan Date | Disbursement Date | Loan Amount | Loan Duration(months)
1 | 10/2020 | 10/2016 | 20,000$ | 48
2 | 09/2021 | 9/2013 | 9,800$ | 96
3 | 2/2018 | 7/2015 | 3000$ | 31
By this data, I can calculate The amount paid every month ( Loan Amount / Loan duration) supposed that every customer will pay his debt monthly.
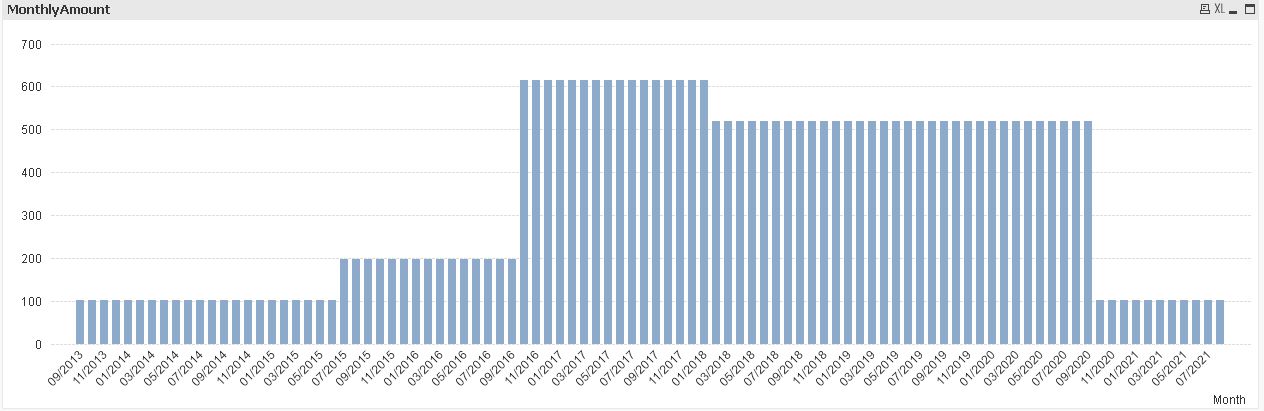
How can we achieve to see a Bar Chart that shows the amount collected every month from all the customers?
Thanks,
Rima
Accepted Solutions
- Mark as New
- Bookmark
- Subscribe
- Mute
- Subscribe to RSS Feed
- Permalink
- Report Inappropriate Content
Hi,
maybe one solution could be:
tabLoans:
LOAD ID,
    Date#([Maturity Loan Date],'MM/YYYY') as [Maturity Loan Date],
    Date#([Disbursement Date],'MM/YYYY') as [Disbursement Date],
    Money#([Loan Amount]) as [Loan Amount],
    [Loan Duration(months)]
Inline [
ID | Maturity Loan Date | Disbursement Date | Loan Amount | Loan Duration(months)
1  | 10/2020            | 10/2016          | 20,000$    | 48
2  | 09/2021            | 9/2013            | 9,800$      | 96
3  | 2/2018            | 7/2015            | 3000$      | 31
] (delimiter is '|');

tabLoanMonth:
LOAD ID,
    Date(AddMonths([Disbursement Date],IterNo()-1),'MM/YYYY') as Month,
    Money([Loan Amount]/[Loan Duration(months)]) as MonthlyAmount
Resident tabLoans
While IterNo() <= [Loan Duration(months)];
hope this helps
regards
Marco
- Mark as New
- Bookmark
- Subscribe
- Mute
- Subscribe to RSS Feed
- Permalink
- Report Inappropriate Content
Hello Marco,
Thanks for the solution, I implement your solution on my data , but the bar chart is showing the screenshot below, how can I aggregate the amount of every month into one record?

Thanks!
- Mark as New
- Bookmark
- Subscribe
- Mute
- Subscribe to RSS Feed
- Permalink
- Report Inappropriate Content
Don't worry! I solved it , I added this 2 lines to the script
Year(Date(AddMonths(DisbursementDate,IterNo()-1),'MM/YYYY')) as YearLoanIncome,
Month(Date(AddMonths(DisbursementDate,IterNo()-1),'MM/YYYY')) as MonthLoanIncome,
and then added the 2 to a drill down master item.
Thanks Again Marco