Unlock a world of possibilities! Login now and discover the exclusive benefits awaiting you.
- Qlik Community
- :
- All Forums
- :
- QlikView App Dev
- :
- Re: Table Chart Calculated Total in Additional Fie...
- Subscribe to RSS Feed
- Mark Topic as New
- Mark Topic as Read
- Float this Topic for Current User
- Bookmark
- Subscribe
- Mute
- Printer Friendly Page
- Mark as New
- Bookmark
- Subscribe
- Mute
- Subscribe to RSS Feed
- Permalink
- Report Inappropriate Content
Table Chart Calculated Total in Additional Field
Hi Guys,
I want to show in a table chart following total field:
Data:
| Person | Working Hours | Costs | Month |
|---|---|---|---|
| P1 | 35 | 1000 | 03.2017 |
| P1 | 36 | 1300 | 04.2017 |
| P1 | 31 | 900 | 05.2017 |
| P2 | 45 | 1000 | 03.2017 |
| P2 | 54 | 2000 | 04.2017 |
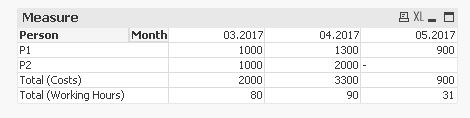
| Month | 03.2017 | 04.2017 | 05.2017 |
| Person | sum(Costs) | sum(Costs) | sum(Costs) |
|---|---|---|---|
| Total (Working Hours) | 80 | 90 | 31 |
| Total (Costs) | 2000 | 3300 | 900 |
| P1 | 1000 | 1300 | 900 |
| P2 | 2000 | 2000 | - |
I know how I can show Total sum of Costs, but how can I show Total sum of Working Hours without a column in Expressions?
Accepted Solutions
- Mark as New
- Bookmark
- Subscribe
- Mute
- Subscribe to RSS Feed
- Permalink
- Report Inappropriate Content
May be this?
- Mark as New
- Bookmark
- Subscribe
- Mute
- Subscribe to RSS Feed
- Permalink
- Report Inappropriate Content
May be this?
- Mark as New
- Bookmark
- Subscribe
- Mute
- Subscribe to RSS Feed
- Permalink
- Report Inappropriate Content
Hi Anil,
this is good. But what exactly do you make with Dim and why Dim is from 1-3?
- Mark as New
- Bookmark
- Subscribe
- Mute
- Subscribe to RSS Feed
- Permalink
- Report Inappropriate Content
To customize the special adding(not existing the rows) for special rows, I am creating sequential numbers using Dim which has 1,2,3 because In UI it showing Person, Costs, Hours. That means i am allocating to each Dim value to Person and Costs and Hours. After that i made expression to fit each dim of all measures for customize one..
Does it make sense ??
Note - Please mark it as helpful and Correct answer when applicable.
- Mark as New
- Bookmark
- Subscribe
- Mute
- Subscribe to RSS Feed
- Permalink
- Report Inappropriate Content
Hi Anil,
yes I understand. it's perfect. Many Thanks