Unlock a world of possibilities! Login now and discover the exclusive benefits awaiting you.
- Qlik Community
- :
- All Forums
- :
- QlikView App Dev
- :
- Re: Use an expression result within another expres...
- Subscribe to RSS Feed
- Mark Topic as New
- Mark Topic as Read
- Float this Topic for Current User
- Bookmark
- Subscribe
- Mute
- Printer Friendly Page
- Mark as New
- Bookmark
- Subscribe
- Mute
- Subscribe to RSS Feed
- Permalink
- Report Inappropriate Content
Use an expression result within another expression
Is it possible to create a new expression to calculate the amount of instances whereby a number is greater than a predefined number, and then use the results of that expression within another expression?
Accepted Solutions
- Mark as New
- Bookmark
- Subscribe
- Mute
- Subscribe to RSS Feed
- Permalink
- Report Inappropriate Content
Well, to begin with get rid of the vDelayMins: in the expression. Then it looks the same as your second expression. It will work, but that's probably not what you want. If you press CTRL+V the variables screen opens. If you click on Add you can add a variable you can name vDelayMins. Once you've added it you can click on it and give it as value Sum(SCH)-Sum(CHKS). You can then create an expression in your chart with for example as definition if($(vDelayMins)<-15,'Delayed','Not Delayed')
talk is cheap, supply exceeds demand
- Mark as New
- Bookmark
- Subscribe
- Mute
- Subscribe to RSS Feed
- Permalink
- Report Inappropriate Content
Yes, that's possible. To make reuse easier and improve readability you can put the first expression in a variable and use the variable in the second expression.
vSumSales: sum(Sales)
Expression2: aggr($(vSumSales),Month)
talk is cheap, supply exceeds demand
- Mark as New
- Bookmark
- Subscribe
- Mute
- Subscribe to RSS Feed
- Permalink
- Report Inappropriate Content
Hi I have tried to put my first expression in a variable as you have stated but the data just disappears.
my expression reads:
vDelayMins: Sum(SCH)-Sum(CHKS)
then I was going to load DelayMins to calculate the amount of data that has a value of -15 or more
- Mark as New
- Bookmark
- Subscribe
- Mute
- Subscribe to RSS Feed
- Permalink
- Report Inappropriate Content
See attached example. It has a variable vYearDiff that calculates the sales difference between two years. This variable is then used in the expression Diff 2008 - 2009 in the straight table: if($(vYearDiff)>0,'Up','Down'). If the result of vYearDiff > 0 then sales increased, otherwise the declined.
talk is cheap, supply exceeds demand
- Mark as New
- Bookmark
- Subscribe
- Mute
- Subscribe to RSS Feed
- Permalink
- Report Inappropriate Content
Im not able to load the file as I did not create it
- Mark as New
- Bookmark
- Subscribe
- Mute
- Subscribe to RSS Feed
- Permalink
- Report Inappropriate Content
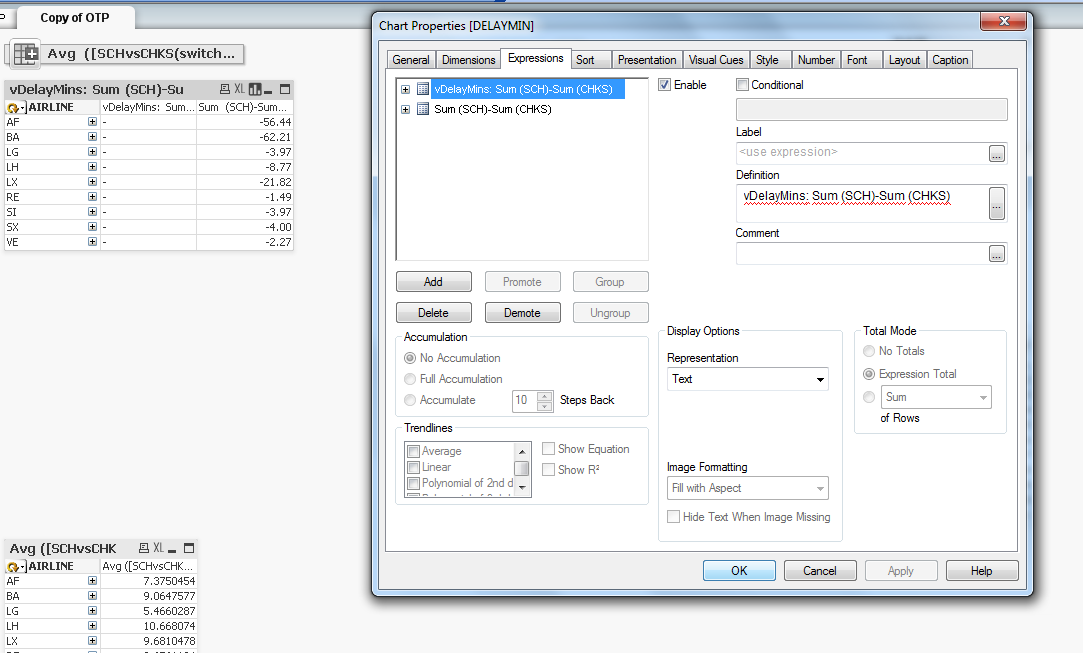
I have taken a screen shot can you advise where I am going wrong.
Instaed of a - the two columns should be displaying the same information. once I get the first column to deiplay the correct informtion I can then start to build the if statement to calculate the number greater than -15
- Mark as New
- Bookmark
- Subscribe
- Mute
- Subscribe to RSS Feed
- Permalink
- Report Inappropriate Content
Well, to begin with get rid of the vDelayMins: in the expression. Then it looks the same as your second expression. It will work, but that's probably not what you want. If you press CTRL+V the variables screen opens. If you click on Add you can add a variable you can name vDelayMins. Once you've added it you can click on it and give it as value Sum(SCH)-Sum(CHKS). You can then create an expression in your chart with for example as definition if($(vDelayMins)<-15,'Delayed','Not Delayed')
talk is cheap, supply exceeds demand
- Mark as New
- Bookmark
- Subscribe
- Mute
- Subscribe to RSS Feed
- Permalink
- Report Inappropriate Content
Hi firstly as I havent stated yet thank you so much for trying to help me resolve this issue with such prompt responses.
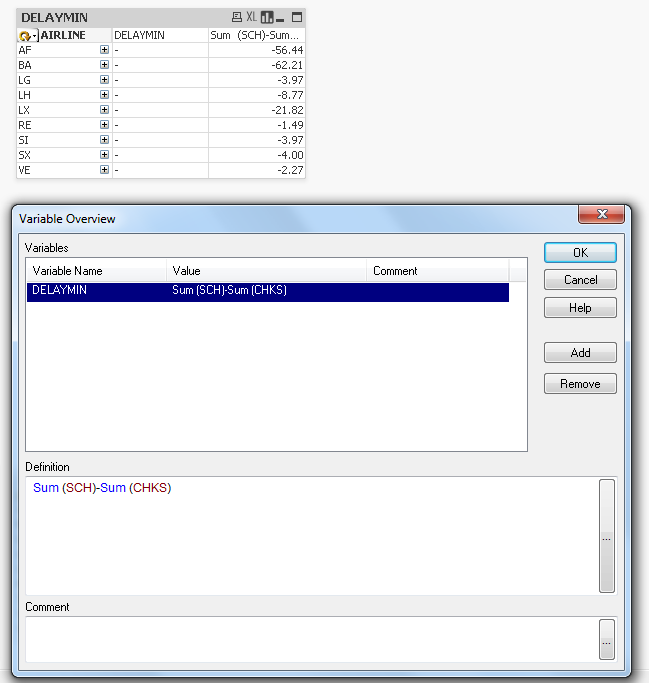
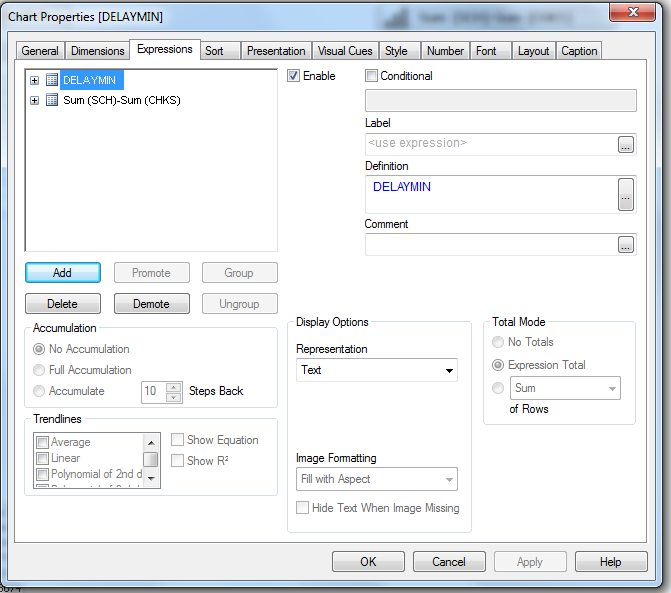
I have took two more screenshots as I had initially done as you said but the information still showed a -
- Mark as New
- Bookmark
- Subscribe
- Mute
- Subscribe to RSS Feed
- Permalink
- Report Inappropriate Content
You didn't do the dollar expansion yet. Change the definition of the expression to $(DELAYMIN)
talk is cheap, supply exceeds demand
- Mark as New
- Bookmark
- Subscribe
- Mute
- Subscribe to RSS Feed
- Permalink
- Report Inappropriate Content
Hi that worked a treat figures populated thanks so much, my second part I had hoped would have been resolved by the if statement you created it shows all as not delayed if if the value is less than -15 ie say -3 still showing not delayed