Unlock a world of possibilities! Login now and discover the exclusive benefits awaiting you.
- Qlik Community
- :
- All Forums
- :
- QlikView App Dev
- :
- Using TOTAL to get % all Data
- Subscribe to RSS Feed
- Mark Topic as New
- Mark Topic as Read
- Float this Topic for Current User
- Bookmark
- Subscribe
- Mute
- Printer Friendly Page
- Mark as New
- Bookmark
- Subscribe
- Mute
- Subscribe to RSS Feed
- Permalink
- Report Inappropriate Content
Using TOTAL to get % all Data
Below I have the data and result I am looking for. I can't figure out how to get the column: All Groups % of Total. This column takes revenue by area for ALL groups divided by total revenue for all groups and all areas. (Example for "North"...All north revenue is 60 and all revenue is 360...thus it is 17%)
| DATE: | ||||
| Group | Area | Revenue | ||
| 1 | North | 10 | ||
| 1 | South | 20 | ||
| 1 | East | 30 | ||
| 1 | West | 40 | ||
| 2 | North | 50 | ||
| 2 | South | 60 | ||
| 2 | East | 70 | ||
| 2 | West | 80 | ||
| RESULT (filtered on Group 1): | ||||
| Group | Area | Revenue | All Groups by Area | All Groups % of Total |
| 1 | North | 10 | 60 | 17% |
| 1 | South | 20 | 80 | 22% |
| 1 | East | 30 | 100 | 28% |
| 1 | West | 40 | 120 | 33% |
| 100 | 360 | 100% | ||
Accepted Solutions
- Mark as New
- Bookmark
- Subscribe
- Mute
- Subscribe to RSS Feed
- Permalink
- Report Inappropriate Content
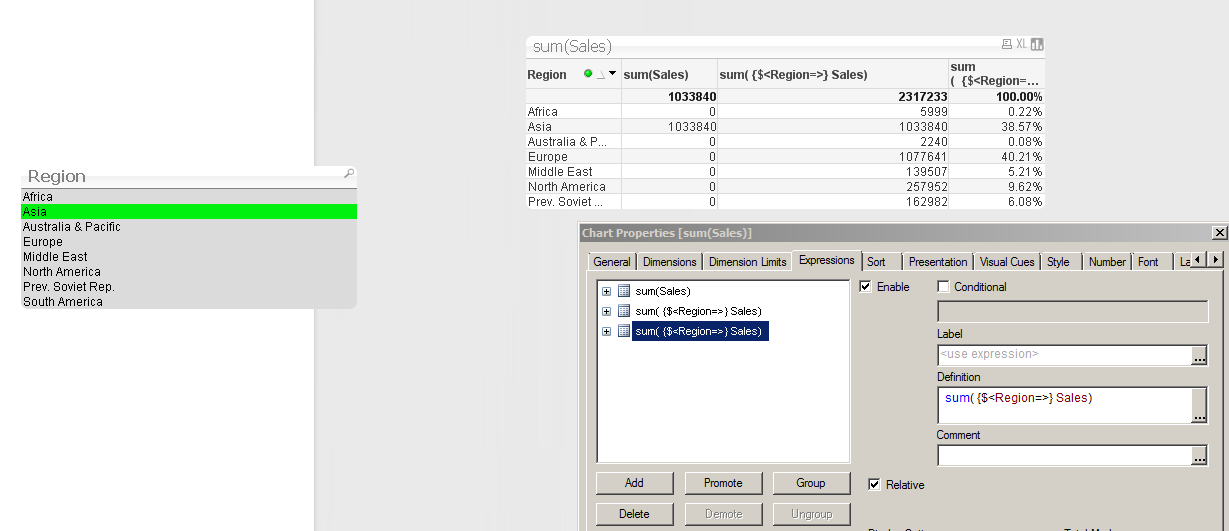
There is a checkbox on the expressions tab called 'relative' .
Try copying and pasting your 2nd expression into a 3rd expression and this time enabling the relative checkbox.
Here is a screenshot with an example:
1st expression is just current selections (ASIA)
2nd expression is same but shows for all regions
3rd is same as 2nd with 'relative' checked
- Mark as New
- Bookmark
- Subscribe
- Mute
- Subscribe to RSS Feed
- Permalink
- Report Inappropriate Content
Thanks! Too simple!
- Mark as New
- Bookmark
- Subscribe
- Mute
- Subscribe to RSS Feed
- Permalink
- Report Inappropriate Content
haha. was using the tool 3 years before someone showed me there was actually a shortcut  works well when there is only 1 dimension.