Unlock a world of possibilities! Login now and discover the exclusive benefits awaiting you.
- Qlik Community
- :
- All Forums
- :
- QlikView Administration
- :
- Re: document took very long and not loading
- Subscribe to RSS Feed
- Mark Topic as New
- Mark Topic as Read
- Float this Topic for Current User
- Bookmark
- Subscribe
- Mute
- Printer Friendly Page
- Mark as New
- Bookmark
- Subscribe
- Mute
- Subscribe to RSS Feed
- Permalink
- Report Inappropriate Content
document took very long and still did not open
Hi,
One of the qlikview document took very long and still did not open (load into memory). The users had been waiting for almost an hour and then we had to restart the server and it worked fine. I was going through the event logs and found the below entries

It kept on like that with entries like updateshared file or Document Load ODE1 etc as you can see below
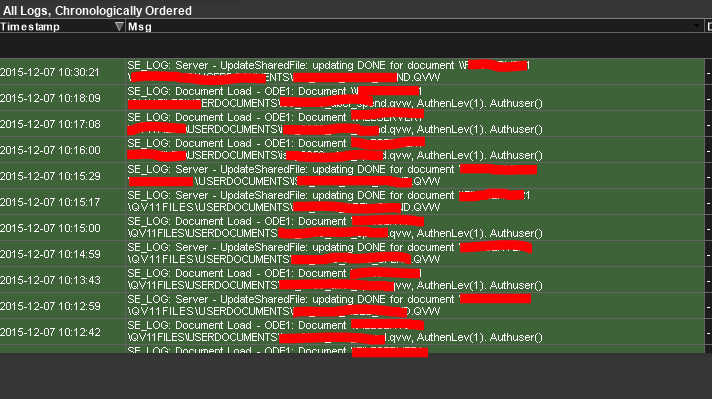
It never finished the document load
eventually we had to restart the server and then it worked fine

My Assumption: This is a big document and usually takes 3-4 minutes to load first time. However, could it be possible that when it was not in memory, a lot of users tried to open the document and it tried to load it into memory for all users or something like that. I dont know but could the multiple users accessing the same file slow it down if the document is first time loading into memory?
- Tags:
- qlikview_deployment
- Mark as New
- Bookmark
- Subscribe
- Mute
- Subscribe to RSS Feed
- Permalink
- Report Inappropriate Content
What are the entries in the QDS log and document log for this reload?
The QlikView logs are more likely to indicate the problem than the server event logs.
- Mark as New
- Bookmark
- Subscribe
- Mute
- Subscribe to RSS Feed
- Permalink
- Report Inappropriate Content
but here, I am talking about document load (opening the document on qlikview server) and not document data reload . Sorry for the miscommunicating my problem. I have updated the problem description. Thanks for identifying it
- Mark as New
- Bookmark
- Subscribe
- Mute
- Subscribe to RSS Feed
- Permalink
- Report Inappropriate Content
How much RAM is installed on your server and how much RAM was QVS using when the problem occurred?
How much RAM does the app consume on the server now?
Are the tables in your data model correctly associated?
It may be worth running the app through Rob Wunderlich's Document Analyser to identify unused fields and other issues. http://qlikviewcookbook.com/recipes/download-info/document-analyzer/
- Mark as New
- Bookmark
- Subscribe
- Mute
- Subscribe to RSS Feed
- Permalink
- Report Inappropriate Content
The server has a very good resources. It has 384 gb of ram and when the issue happened, even half of the ram was not in use. The CPU was also making the normal peaks and spikes and there did not seem anything abnormal on the server side
- Mark as New
- Bookmark
- Subscribe
- Mute
- Subscribe to RSS Feed
- Permalink
- Report Inappropriate Content
How are the users accessing the app? Are they using Ajax or the IE plugin?
Does your app have any table/ objects with a large number of rows, these can take a while to open.
Can you use a calculation condition to require the users to filter the data to show fewer than N rows before calculating the charts, this can improve performance.
- Mark as New
- Bookmark
- Subscribe
- Mute
- Subscribe to RSS Feed
- Permalink
- Report Inappropriate Content
The customers are using Ajax. This is indeed a very big document and has around 40 million records. However, this document works fine and it was only today when it happened and we are looking for an explanation to see why has it happened and how to prevent this