Unlock a world of possibilities! Login now and discover the exclusive benefits awaiting you.
- Qlik Community
- :
- Forums
- :
- Analytics & AI
- :
- QlikView
- :
- Documents
- :
- Control Chart
- Subscribe to RSS Feed
- Mark as New
- Mark as Read
- Bookmark
- Subscribe
- Printer Friendly Page
- Report Inappropriate Content
Control Chart
- Mark as New
- Bookmark
- Subscribe
- Mute
- Subscribe to RSS Feed
- Permalink
- Report Inappropriate Content
Control Chart
Sep 25, 2024 3:27:27 PM
Mar 20, 2016 3:37:57 AM
What is Control Chart?
The control chart is a statistical analysis used to study how a process changes over time. Data are plotted in time order. Control charts are used to routinely monitor quality or simply you can say, control chart is process improvement technique.
There are many types of control charts, but we will focus on the basic control chart using the standard deviation method to understand the concept.
The following are some scenarios where control charts can be applied:
-
In manufacturing, to test whether machinery is producing products within specifications.
-
If you want to reduce the time it takes to admit a patient to the hospital.
-
To analyze how the number of views is increasing or decreasing for a particular website.
Components of Control Chat
1) Avg line
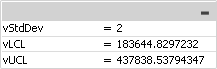
2) UCL (Upper Control line) = Avg Value + Std Deviation* Std Dev Multiplier
3) LCL (Lower control line) = Avg Value - Std Deviation* Std Dev Multiplier
So, basically we can see which are the points "Out of Control" or "In Control".
You can control your Std Dev multiplier using variable.
How to Create a Control Chart:
-
Create a Combo Chart.
-
Select a Time Dimension: Choose a time dimension that suits your analysis; for this example, I have selected MonthYear. Also, ensure that it is set to continuous in the axis settings.
-
Create Two Expressions: Create one expression for the line and another for the symbol.
-
Create expressions for the average line, Upper Control Limit (UCL), and Lower Control Limit (LCL), which will be used as reference lines in the chart. To set these reference lines, go to Chart Properties and navigate to the Presentation section.
-
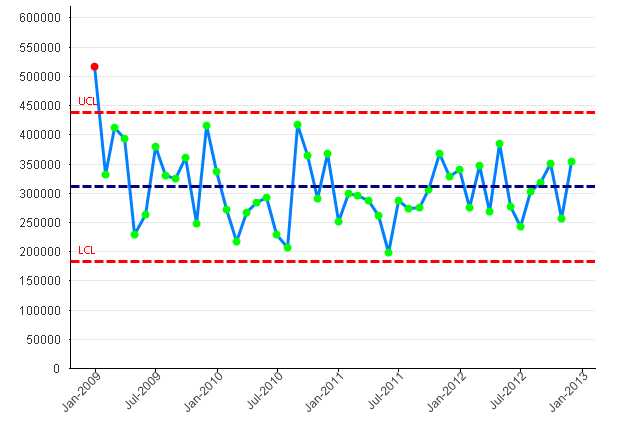
Create the Background color setting for the Symbol expression


if( sum(Sales) < vUCL and sum(Sales) > vLCL, LightGreen(), LightRed())
Finally, the chart will appear as shown below
Please refer to the below link for further details
Additionally, please see:
- Mark as Read
- Mark as New
- Bookmark
- Permalink
- Report Inappropriate Content
We have released a Control Chart extension for Qlik Sense. More information and a 60 day trial can be downloaded from here.
Key features include: • Outliers Highlighted • Runs ‘above’ and ‘below’ the average highlighted • Trends up and down highlighted • Moving average based on Runs and/ or Trend triggers
Key configuration options include: • Customise Labels for Dimensions, Measures and Rules • Customise Line and point style for Dimensions, Measures and Rules • Pick the number of points to set the highlighting criteria for both Runs and Trends
For more information email: extensions@acumenbi.co.nz .
- Mark as Read
- Mark as New
- Bookmark
- Permalink
- Report Inappropriate Content
Could i just clarify something......
The value for vStdDev is set here as "2"
Is this a standard value or does it differ dependant on other factors?
Thanks.
- Mark as Read
- Mark as New
- Bookmark
- Permalink
- Report Inappropriate Content
This is standard deviation and it differs based on requirement. By definition, standard deviation 2 covers the 95% spread of your data. You can use 3 as well to get more spread of your data.
- Mark as Read
- Mark as New
- Bookmark
- Permalink
- Report Inappropriate Content
Thanks for coming back to me, much appreciated. Just wasn't sure what the 2 or 3 equalled when determining standard deviation.
Thank you.
- Mark as Read
- Mark as New
- Bookmark
- Permalink
- Report Inappropriate Content
Hey @Kushal_Chawda great post thanks for your help 🙂
From your own experience do you think this can work with the OOTB combo chart for Qlik Sense?
I want to use the OOTB one as opposed to the Vizlib one due to the Y-Axis automatically adjusting for values, however I cannot seem to locate an option to add a reference line in the OOTB version.
Thanks in advance!
- Mark as Read
- Mark as New
- Bookmark
- Permalink
- Report Inappropriate Content
Thank you Mr. Kushal.
Please help on how to do this in Qlik Sense?
Thanks,
Mhidz
- « Previous
-
- 1
- 2
- Next »