Unlock a world of possibilities! Login now and discover the exclusive benefits awaiting you.
- Qlik Community
- :
- All Forums
- :
- QlikView Integrations
- :
- Re: Google Maps - Cluster
- Subscribe to RSS Feed
- Mark Topic as New
- Mark Topic as Read
- Float this Topic for Current User
- Bookmark
- Subscribe
- Mute
- Printer Friendly Page
- Mark as New
- Bookmark
- Subscribe
- Mute
- Subscribe to RSS Feed
- Permalink
- Report Inappropriate Content
Google Maps - Cluster
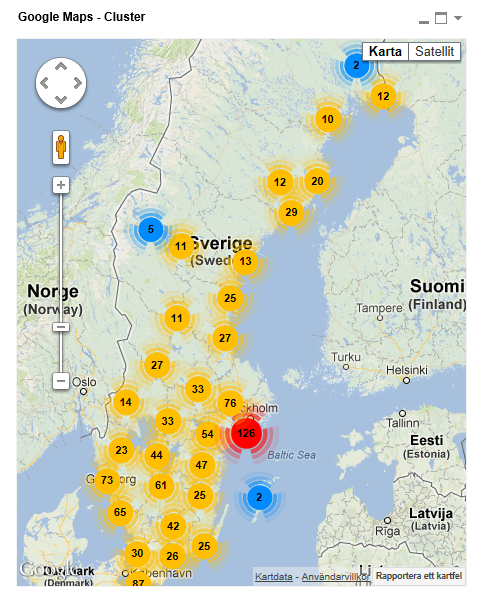
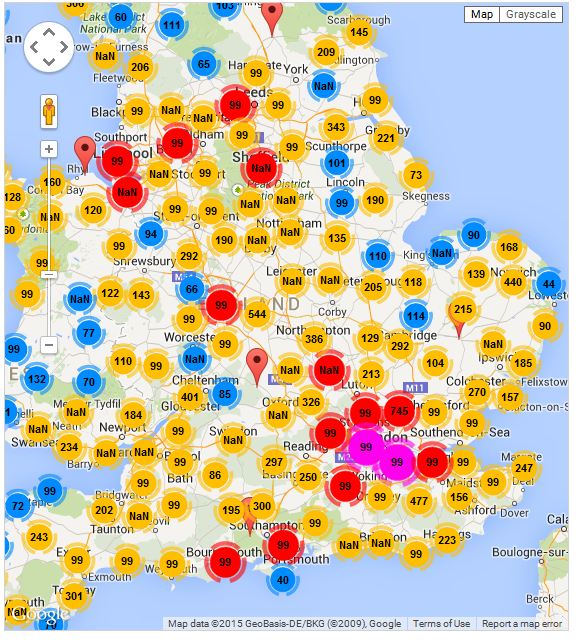
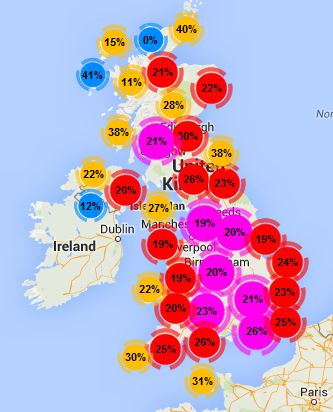
Google Maps Extension with Cluster support.
QlikTech takes no responsibility for any code and QlikTech Support Agreement does not cover issues with this extension.
Please review Googles license agreement before you put this into production.
Introduction
This is a QlikView extension object that integrates Google Maps Javascript API V3 and a third party library called MarkerClusterPlus into QlikView.
Load a set a coordinates into QlikView and visualize them together with this extension. The clustering feature is create when you have alot of data points and needs to group/cluster them together for greater visability and performance.
The maxzoom property defines at what zoom level you want your markers clustered. The grid size property controls how big or small cluster grid size you want.
You can either use the extension 'as is' or use it as a base to further customize it to fit your needs.
Download the extension and view source code at: https://github.com/mindspank/GoogleMaps-Cluster-QV11
If you build something awesome please share it with the community!
Live long and prosper.
2015-02-15
Removed download from post, please grab the latest version from Github instead.
2014-02-03
Various fixes.
2014-01-09
There has been numerous upgrades to the extension.
Now clusters now display the value of your expression and with added support to include more information in pop-up labels.
Example grayscale styled map included.
Possibility to show only a single cluster icon style if you do not want it to scale according to the number of markers in the cluster.
2013-06-17
Added custom marker support. Now you can specify a url for an custom marker. Accepts all major image file types.
- Tags:
- clustering
- extension
- extension_object
- geospatial
- google cluster maps
- google maps
- javascript
- map
- mapping
- qlikview extensions
- qlikview_extensions
- Mark as New
- Bookmark
- Subscribe
- Mute
- Subscribe to RSS Feed
- Permalink
- Report Inappropriate Content
please check out our solutions:
- Mark as New
- Bookmark
- Subscribe
- Mute
- Subscribe to RSS Feed
- Permalink
- Report Inappropriate Content
Hi Alex,
I have the extension working well but I'm trying to change the cluster to instead of suming up the total of the points to display the avg of the points under the cluster. The map is showing the penetration rate for the data by postcode district so the avg although fairly loose would work better for me. Have had a look at the js behind the place I thought it was happening isn't correct place and now a bit stuck.
Many thanks for the extension
- Mark as New
- Bookmark
- Subscribe
- Mute
- Subscribe to RSS Feed
- Permalink
- Report Inappropriate Content
Hmm, can you create a straight table with latitude and longitude as dimensions and the same expressions as you use in the map. I thought the NaN was a bit strange, so the straight table would help me see which value was being reported back as NaN
- Mark as New
- Bookmark
- Subscribe
- Mute
- Subscribe to RSS Feed
- Permalink
- Report Inappropriate Content
Hi Alex,
Cracked the average value to be displayed in the grouped cluster. Changed the code in script.js to :
var abbreviatedValue = Math.floor( abbreviateNumber(measure/count))
Then added the % to the displayed text and works fine. The "NaN" issue is nothing to do with code or data. If you look at the Popup contents I had something along the lines of ="Pen Rate = " & calculation. Once I changed this to "=calculation & " %" it worked.
For some reason having the text at the start meant that everything including nulls are displayed. Haven't got a clue why this happens and can't find anything in code which forces this to happen.
Thanks
- Mark as New
- Bookmark
- Subscribe
- Mute
- Subscribe to RSS Feed
- Permalink
- Report Inappropriate Content
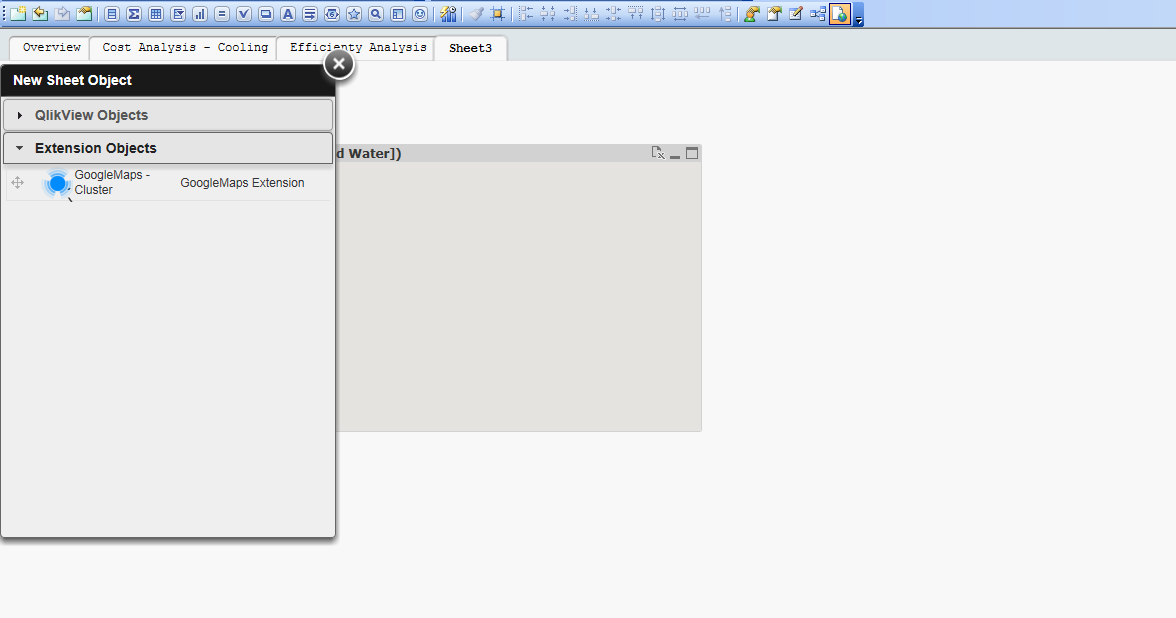
Hi I downloaded and installed the map extension. However, when I dragged the object to my sheet, it's just a blank object no map or anything. When I go to Properties, I don't get a drop down to select latitude etc. Has anyone else seen this? Hopefully something obvious I missed.. Thanks in advance in any help on this!
- Mark as New
- Bookmark
- Subscribe
- Mute
- Subscribe to RSS Feed
- Permalink
- Report Inappropriate Content
Hi Judy,
did you activate "WebView" ?

You need to activate it to see the extension locally.
Best regards,
Ronny
- Mark as New
- Bookmark
- Subscribe
- Mute
- Subscribe to RSS Feed
- Permalink
- Report Inappropriate Content
Hi Ronny, thank you for the quick reply! I did use the Web view.. Watched the 10- min Youtube video, thought I followed the exact steps.. 
- Mark as New
- Bookmark
- Subscribe
- Mute
- Subscribe to RSS Feed
- Permalink
- Report Inappropriate Content
Hi Judy,
Did you access the property menu of the extension itself ?
- Mark as New
- Bookmark
- Subscribe
- Mute
- Subscribe to RSS Feed
- Permalink
- Report Inappropriate Content
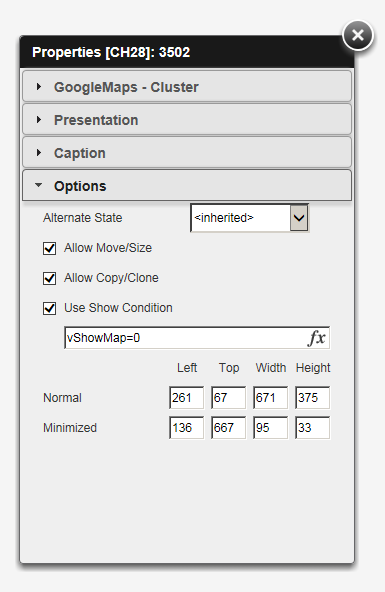
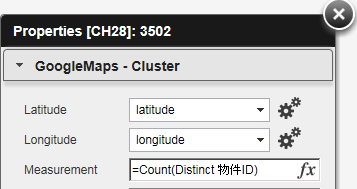
I just looked at it. Am I supposed to change anything? See my screen.. Again, thanks a lot!

- Mark as New
- Bookmark
- Subscribe
- Mute
- Subscribe to RSS Feed
- Permalink
- Report Inappropriate Content
Under the Tab "GoogleMaps - Cluster" you can set your latitude, longitude & measurements.
Did you do that already.
Ronny