Unlock a world of possibilities! Login now and discover the exclusive benefits awaiting you.
- Qlik Community
- :
- All Forums
- :
- QlikView Integrations
- :
- Re: Google Maps - Heatmap
- Subscribe to RSS Feed
- Mark Topic as New
- Mark Topic as Read
- Float this Topic for Current User
- Bookmark
- Subscribe
- Mute
- Printer Friendly Page
- Mark as New
- Bookmark
- Subscribe
- Mute
- Subscribe to RSS Feed
- Permalink
- Report Inappropriate Content
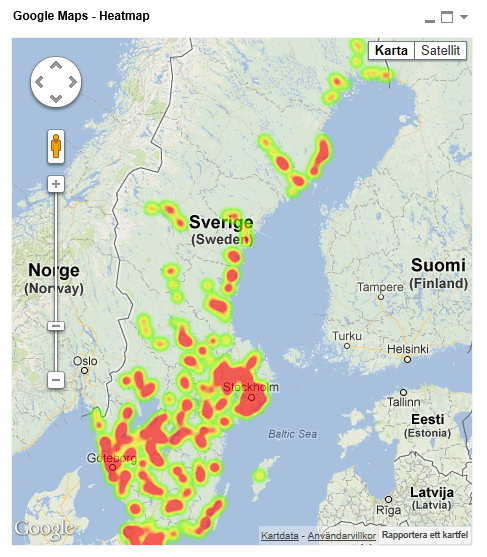
Google Maps - Heatmap
Google Maps Extension with Heatmap support.
QlikTech takes no responsibility for any code and QlikTech Support Agreement does not cover issues with this extension.
Please review Googles license agreement before you put this into production.
Big thanks to pablolabbe for contributing to the project.
Download
mindspank/GoogleMaps-Heatmap-QV11 · GitHub
Introduction
A new addition to the Google Maps family. This extensions will take your data points and produce a heatmap on top of a Google Map.
A good tool easily spot areas with higher intensity of data points. There is no selection support for this extension has there is no markers available at the moment.
You can either use the extension 'as is' or use it as a base to further customize it to fit your needs.
2013-12-14
Finally tracked down the errors when you tried to pass in faulty data.
Less DOM-calls.
2013-06-04
Added a check that QV passes valid data points to Google. If you are passing an invalid data point it will log it to the console in your browser.
Also enabled weighted data points. Now the weight if your data point in the heatmap will correspond to your expression value. If you want equal weight between the points, e.g the original heatmap where the number of data points determined your heat level, set a arbitrary value of =1
If you build something awesome please share it with the community!
Live long and prosper.
- Tags:
- extension
- extension_object
- full-web mapping extension for qlikview and sense
- geospatial
- google map
- heatmap
- heatmaps
- map
- qlikview extensions
- qlikview_extensions
- Mark as New
- Bookmark
- Subscribe
- Mute
- Subscribe to RSS Feed
- Permalink
- Report Inappropriate Content
Well, you need to download the qar file and install it. Then you need to have web view enabled if you are using QlikView Desktop.
Kind Regards
Alexander Karlsson
29 jun 2013 kl. 16:26 skrev "Itamar Vieira" <qcwebmaster@qlik.com<mailto:qcwebmaster@qlik.com>>:
QlikCommunity<http://community.qlik.com/index.jspa>
Re: Google Maps - Heatmap
created by Itamar Vieira<http://community.qlik.com/people/azevedodv> in Integration and Extensions - View the full discussion<http://community.qlik.com/message/362361#362361>
- Mark as New
- Bookmark
- Subscribe
- Mute
- Subscribe to RSS Feed
- Permalink
- Report Inappropriate Content
Does anyone knows if the heatmap extension works also in combination with Windows XP and IE 8.0?
Just getting the google map but no heat layer.
- Mark as New
- Bookmark
- Subscribe
- Mute
- Subscribe to RSS Feed
- Permalink
- Report Inappropriate Content
Nope, requires a modern browser. IE9, Firefox, Chrome or Safari
Kind Regards
Alexander Karlsson
12 jul 2013 kl. 15:02 skrev "Thomas Schmutz" <qcwebmaster@qlik.com<mailto:qcwebmaster@qlik.com>>:
QlikCommunity<http://community.qlik.com/index.jspa>
Re: Google Maps - Heatmap
created by Thomas Schmutz<http://community.qlik.com/people/schmutzth> in Integration and Extensions - View the full discussion<http://community.qlik.com/message/367265#367265>
- Mark as New
- Bookmark
- Subscribe
- Mute
- Subscribe to RSS Feed
- Permalink
- Report Inappropriate Content
Ok, good to know.
Thank you for the amazing work an the fast answer!
Regards,
Thomas
- Mark as New
- Bookmark
- Subscribe
- Mute
- Subscribe to RSS Feed
- Permalink
- Report Inappropriate Content
Ok, good to know.
Thank you for the amazing work an the fast answer!
Regards,
Thomas
- Mark as New
- Bookmark
- Subscribe
- Mute
- Subscribe to RSS Feed
- Permalink
- Report Inappropriate Content
Hey All,
I have tried the heat map functionality with success and like how it looks. However, I am wondering if there is a tool that can make U.S. states a varying shade of one color (across the entire state) based on the intensity or frequency in which something occurs. I have not yet seen something that can apply a uniform color accross the state on any Extensions. Any ideas? Appreciate your help!
- Mark as New
- Bookmark
- Subscribe
- Mute
- Subscribe to RSS Feed
- Permalink
- Report Inappropriate Content
Hi. First of all you all are so helpful! Thanks. I have a problem: I have QV 11 and have google chrome. But I am not getting any heat layers. I tried Sum(lat) and the map appears but no heat layers.. When I try =1 I get no map and no heat layer. Any help please? Also, when i click on the map it still connects to IE 8 even though chrome is my defualt browser. Any help please?
- Mark as New
- Bookmark
- Subscribe
- Mute
- Subscribe to RSS Feed
- Permalink
- Report Inappropriate Content
I have an issue where it is not showing the full heat map, only the easten part of the US. When I select a specific state or several states they correctly show... it is as if there is a max number of data points possible with the heat map? I have a very simple table with about 43k rows in it.
- Mark as New
- Bookmark
- Subscribe
- Mute
- Subscribe to RSS Feed
- Permalink
- Report Inappropriate Content
As default the extension has a limit of 20k data points.
If you want to change that, open up the definition.xml file and change the PageHeight attribute to 100 000 you will get all of your data points.
- Mark as New
- Bookmark
- Subscribe
- Mute
- Subscribe to RSS Feed
- Permalink
- Report Inappropriate Content
QlikView Desktop in web view leverages the Internet Explorer API and do not take into account which default browser you have set on your computer. I would recommend that you upgrade Internet Explorer.