Unlock a world of possibilities! Login now and discover the exclusive benefits awaiting you.
- Qlik Community
- :
- All Forums
- :
- QlikView Integrations
- :
- Re: Google Maps - Heatmap
- Subscribe to RSS Feed
- Mark Topic as New
- Mark Topic as Read
- Float this Topic for Current User
- Bookmark
- Subscribe
- Mute
- Printer Friendly Page
- Mark as New
- Bookmark
- Subscribe
- Mute
- Subscribe to RSS Feed
- Permalink
- Report Inappropriate Content
Google Maps - Heatmap
Google Maps Extension with Heatmap support.
QlikTech takes no responsibility for any code and QlikTech Support Agreement does not cover issues with this extension.
Please review Googles license agreement before you put this into production.
Big thanks to pablolabbe for contributing to the project.
Download
mindspank/GoogleMaps-Heatmap-QV11 · GitHub
Introduction
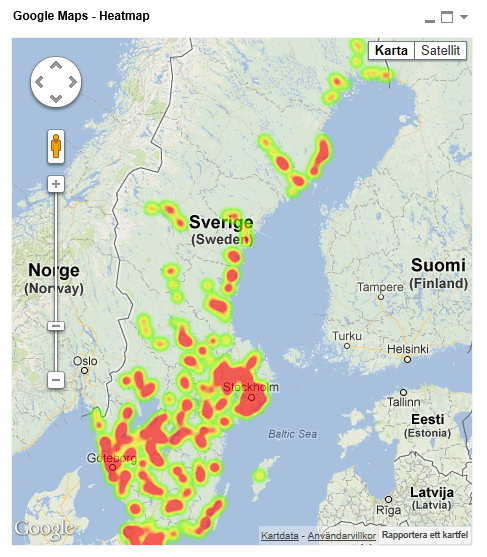
A new addition to the Google Maps family. This extensions will take your data points and produce a heatmap on top of a Google Map.
A good tool easily spot areas with higher intensity of data points. There is no selection support for this extension has there is no markers available at the moment.
You can either use the extension 'as is' or use it as a base to further customize it to fit your needs.
2013-12-14
Finally tracked down the errors when you tried to pass in faulty data.
Less DOM-calls.
2013-06-04
Added a check that QV passes valid data points to Google. If you are passing an invalid data point it will log it to the console in your browser.
Also enabled weighted data points. Now the weight if your data point in the heatmap will correspond to your expression value. If you want equal weight between the points, e.g the original heatmap where the number of data points determined your heat level, set a arbitrary value of =1
If you build something awesome please share it with the community!
Live long and prosper.
- Tags:
- extension
- extension_object
- full-web mapping extension for qlikview and sense
- geospatial
- google map
- heatmap
- heatmaps
- map
- qlikview extensions
- qlikview_extensions
- Mark as New
- Bookmark
- Subscribe
- Mute
- Subscribe to RSS Feed
- Permalink
- Report Inappropriate Content
Hi Alexander
I am very keen to make use of this methodology but cant see the heatmap. I am on Qlikview 11 and IE8. I've noticed a number of other users with a similar problem. Any suggestions on what to do to fix this problem?
Thanks
Jim
- Mark as New
- Bookmark
- Subscribe
- Mute
- Subscribe to RSS Feed
- Permalink
- Report Inappropriate Content
Upgrade to later IE version... The problems I had almost entirely went away when moving to latest IE version.
- Mark as New
- Bookmark
- Subscribe
- Mute
- Subscribe to RSS Feed
- Permalink
- Report Inappropriate Content
This is fucking awesome! Now you should just make it with bar charts in 3D view 
Awesome work
- Mark as New
- Bookmark
- Subscribe
- Mute
- Subscribe to RSS Feed
- Permalink
- Report Inappropriate Content
Is it possible you can fix so if you are missing values it wont crash?
Eg
If i have
five customers with lat and lng it works
but if one of them has null or 0 it doesnt work.
- Mark as New
- Bookmark
- Subscribe
- Mute
- Subscribe to RSS Feed
- Permalink
- Report Inappropriate Content
Thanks for reminding me off this pesky bug.
I uploaded a new version of the extension to the original post that should have a fix for that issue.
For anyone that's interested - don't take shortcuts and reference an array index by markers, use markers.push({...}) instead.
- Mark as New
- Bookmark
- Subscribe
- Mute
- Subscribe to RSS Feed
- Permalink
- Report Inappropriate Content
Thanks alot - Is there a way to set the sizes of the heat? Its just that you need a lot of data to get it to be as visible as you have in sweden.
how do i get a map like the one in the buttom?
‘I can see my house from here’: Google StreetView in Qlikview (with no Extensions) | QVDesign
- Mark as New
- Bookmark
- Subscribe
- Mute
- Subscribe to RSS Feed
- Permalink
- Report Inappropriate Content
The last map on QVDesign is not a heatmap. It's latitude and longitude represented as circles scaled according to a measure. It sounds as a heatmap should not be your choice of visualization for your data.
For the extension - the measure controls the "heat" or intensity. It has nothing to do with scale.
- Mark as New
- Bookmark
- Subscribe
- Mute
- Subscribe to RSS Feed
- Permalink
- Report Inappropriate Content
Hi Alexander,
Thanks for putting this together. I've downloaded the extension and it's working except I'm not seeing the heat maps. if I select data points, it zooms into the area but again all I see is a map with no coloring. Any idea what would be causing this. i"ve attached a screenshot.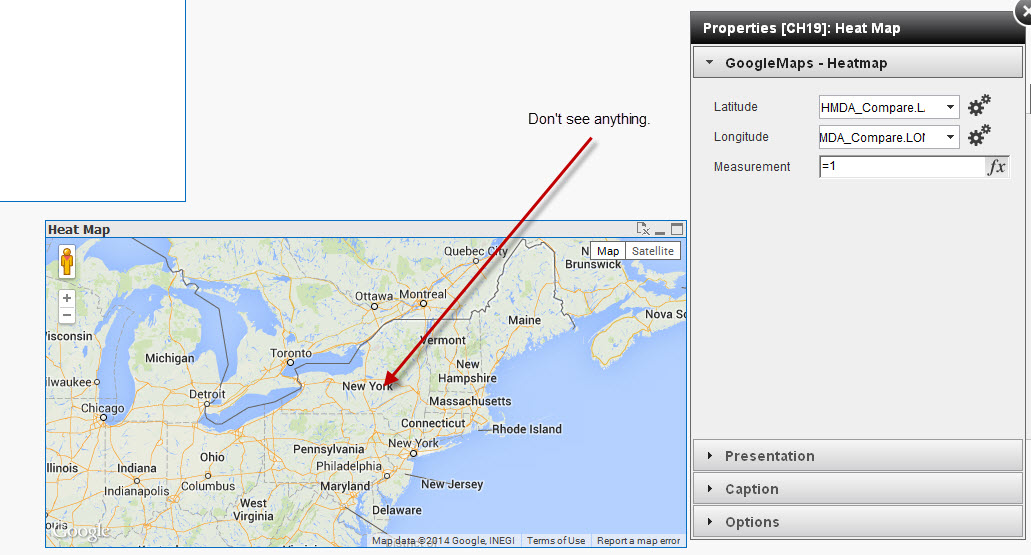
- Mark as New
- Bookmark
- Subscribe
- Mute
- Subscribe to RSS Feed
- Permalink
- Report Inappropriate Content
Which version of internet explorer are you running?
Make sure it's at least IE9, preferably IE10.
- Mark as New
- Bookmark
- Subscribe
- Mute
- Subscribe to RSS Feed
- Permalink
- Report Inappropriate Content
Is IE10 preferred or can I upgrade to version 11. Thanks for the quick
response btw.
Best Regards,
Aron F Elston
PwC | Manager
Office: 2673301536 | Mobile: 9176931822
Email: aron.f.elston@us.pwc.com
PricewaterhouseCoopers LLP
Two Commerce Square, Suite 1700, 2001 Market Street, Philadelphia,
Pennsylvania 19103-7042
http://www.pwc.com/us
Print less, think more.