Unlock a world of possibilities! Login now and discover the exclusive benefits awaiting you.
- Qlik Community
- :
- All Forums
- :
- QlikView Integrations
- :
- Re: Open Source Geospatial Mapping Extension using...
- Subscribe to RSS Feed
- Mark Topic as New
- Mark Topic as Read
- Float this Topic for Current User
- Bookmark
- Subscribe
- Mute
- Printer Friendly Page
- Mark as New
- Bookmark
- Subscribe
- Mute
- Subscribe to RSS Feed
- Permalink
- Report Inappropriate Content
Open Source Geospatial Mapping Extension using KML files
A little while back, I posted a few mapping extensions that read in various kinds of data to allow mapping of regions and data on Google Maps. One major problem with those is that Google is now charging money for useof their mapping product, so in order to use this extension on any grand scale,they'd need to purchase licensing.
So, in response to this, I've built an extension which uses all open source (free) products to provide some similar mapping capabilities(and then some). The tool which provides the scrolling and "slippy" map features is called OpenLayers which reads in map imagery from OpenStreetMap. What I've done this time, however, is built the extension to read in KML files for the regions. KML is a format that is very common in the industry (Google Earth uses and creates the files) ,and there are many tools out there to convert other formats (like shape files) into the KML format.
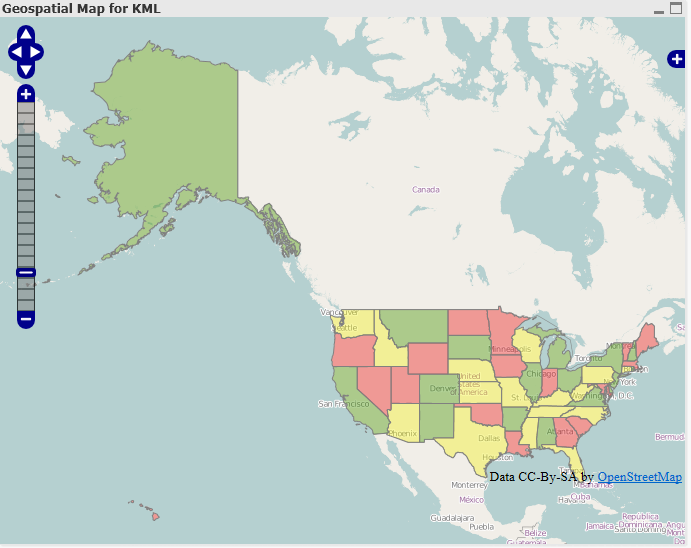
So, for example, I went and found a KML file for the US 50 states and put it into this new extension, and was able to create a map similar to my other US Map extension:
New Features
Above and beyond the normal features of the extensions I created for Google, this extension provides a few new features:
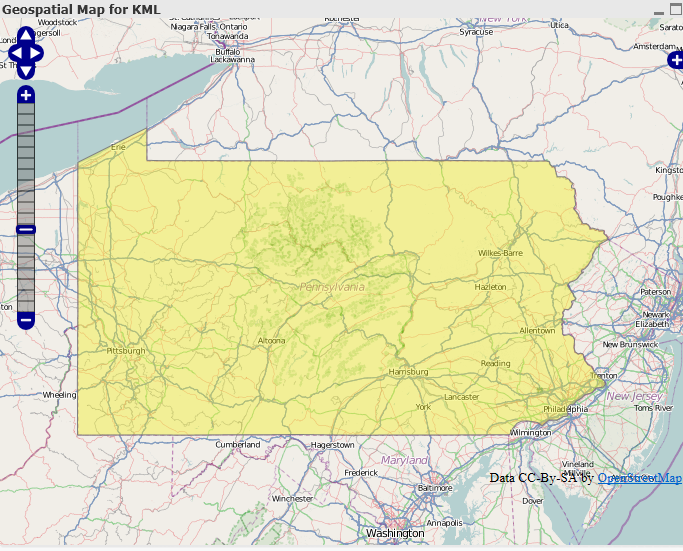
- No more setting the zoom and center point - In the other extensions, you had to set the default center point of the map as well as how far in it should be zoomed when it loads. In order to make the map more user friendly and intuitive, this extension automatically determines the center point of all of the regions and sets the window to show the whole map. This way, also, if you click on a region, the map window will only show the selected region:
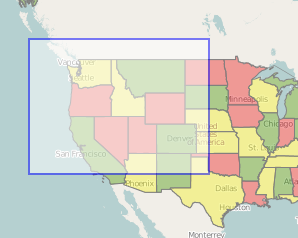
- Select Box -With this extension, if you hold down the shift key and drag an area with your mouse, a select box will appear, allowing you to select many regions at once:
Once the selection is made, the window will adjust itself to only show that region: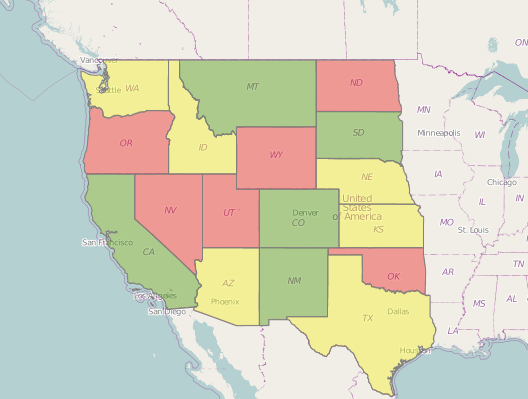
- Loading KML files - Loading KML files into the extension eliminates a lot of the manual work that was need for the other extensions. This way, as long as the KML names and QlikView dimension match up, KML files containing any kinds of regions can be used. So, for example, if a company has custom regions representing different sales regions, etc. in a KML file, it would be very easy to plug it into this extension.
- It's free- It uses open source technology so nobody will have to worry about licensing or being chased down by Google.
I've attached the extension as well as a QVW and quick guide. In the extension is a sample KML file called us_states.kml that can be used with the example QVW.
Please let me know if you have any questions. Hopefully this is useful to people.
UPDATE
Due to some issues with versions of Internet Explorer prior to 9 and how it handles different data formats, it is now necessary to change the KML file into an XML file prior to loading it into the extension. So, for example, if you have a KML named "counties.kml" you need to change the file extension so it becomes "counties.xml". Hopefully I'll eventually get time so this last step can be avoided, but for now it's necessary in order for the extension to work in IE8.
I've updated the attatchments on this post to use an XML file, so the examples should now work.
- Mark as New
- Bookmark
- Subscribe
- Mute
- Subscribe to RSS Feed
- Permalink
- Report Inappropriate Content
Hi Brian Munz,
I have try to customize your extension for Thialand Map it work fine for desktop verion but not working with borwser (Ajax). I don't know what is the problem, please help to suggest.
Regards,
Chonnathan.p
- Mark as New
- Bookmark
- Subscribe
- Mute
- Subscribe to RSS Feed
- Permalink
- Report Inappropriate Content
Hi,
Im trying to do a similar UK heat map similar to yours - are you able to post a sample solution please?
Many thanks,
Fiorano
- Mark as New
- Bookmark
- Subscribe
- Mute
- Subscribe to RSS Feed
- Permalink
- Report Inappropriate Content
Hi Would you mind posting your version ?
- Mark as New
- Bookmark
- Subscribe
- Mute
- Subscribe to RSS Feed
- Permalink
- Report Inappropriate Content
Hiya, sorry for the delay! I've been in the US. I'll make sure that I upload my example if I can work out how!! .. I've created it as a QAR file and the application itself will be exported to the local drive where the extension object is created when you double click. You will have to copy all relevant files to the server folders if you choose to deploy it as for some reason it is only doing the local destination.
- Mark as New
- Bookmark
- Subscribe
- Mute
- Subscribe to RSS Feed
- Permalink
- Report Inappropriate Content
Here you go ..
- Mark as New
- Bookmark
- Subscribe
- Mute
- Subscribe to RSS Feed
- Permalink
- Report Inappropriate Content
Hi,
Is anyone else having problems with running this on the QV server? I have it running on my local machine with no problem but when we have deployed the qvw to the server, the map does not appear on the page. We have installed the .qar file on the server but I think we are missing something.
Any ideas?
Mike.
- Mark as New
- Bookmark
- Subscribe
- Mute
- Subscribe to RSS Feed
- Permalink
- Report Inappropriate Content
Mike,
There are some things you need to set up on the server:
- On System -> Setup -> Security on QEMC, ensure Allow Extensions is ticked.
- The server file locations for extensions are different than for your local machine, so you need to manually copy the extension files to the correct folder.
- Local folder = C:\Users\myuseraccount\AppData\Local\QlikTech\QlikView\Extensions\Objects
- Server folder = C:\ProgramData\QlikTech\QlikViewServer\Extensions\Objects
Hope that helps!
Regards,
Brian
- Mark as New
- Bookmark
- Subscribe
- Mute
- Subscribe to RSS Feed
- Permalink
- Report Inappropriate Content
Is it possible to use multiple map objects in the same document/sheet? It seems to get confused when using different xml files and link fields. One map will work and the other won't. I'd like to allow users to view a map for counties and then switch to a zip code overlay if desired.
-Mark
- Mark as New
- Bookmark
- Subscribe
- Mute
- Subscribe to RSS Feed
- Permalink
- Report Inappropriate Content
Hello everybody,
I hope this thread is still halfway alive. First of all, amazing work Brian, I love the opportunities this Extension provides. I have a couple of questions though.
1. Same as the post above, I'd like to be able to switch between objects in the same map. What could an effective solution look like, assuming I use several different KML/XML files?
2. I noticed, that at least on my workstation, it is not possible to use the mouse to pull the map, as one would be accustomed to from using Google Maps or Open Street View, when having a KML overlay selected. Any not covered area behaves as normal though, does anybody have an explanation or know a fix to this problem?
3. Is it possible to check the zoom factor within the map and thus integrate it into the formula describing coloration? I would like to have different coloring, depending on the zoom level, e.g. having finer detail between ZIP Codes when zooming in. Oh, and if it is possible to read that factor, I would need to know the range it has...
Thanks in advance,
Aiko
- Mark as New
- Bookmark
- Subscribe
- Mute
- Subscribe to RSS Feed
- Permalink
- Report Inappropriate Content
Hi Brian,
I use your map, and it is working great, thanks!
For me, it would be great if this extension could support 'multipolygon' shapes. For example, those are used inside the dutch municipality list from CBS as one municipality is not always closely-knit.
Now, the plugin just shows the first polygon inside the multipolygon tag.
Do you think this is possible? For me, it would be a big improvement!
Thanks, Ernst