Unlock a world of possibilities! Login now and discover the exclusive benefits awaiting you.
- Qlik Community
- :
- All Forums
- :
- QlikView Integrations
- :
- Open Source Geospatial Mapping Extension using KML...
- Subscribe to RSS Feed
- Mark Topic as New
- Mark Topic as Read
- Float this Topic for Current User
- Bookmark
- Subscribe
- Mute
- Printer Friendly Page
- Mark as New
- Bookmark
- Subscribe
- Mute
- Subscribe to RSS Feed
- Permalink
- Report Inappropriate Content
Open Source Geospatial Mapping Extension using KML files
A little while back, I posted a few mapping extensions that read in various kinds of data to allow mapping of regions and data on Google Maps. One major problem with those is that Google is now charging money for useof their mapping product, so in order to use this extension on any grand scale,they'd need to purchase licensing.
So, in response to this, I've built an extension which uses all open source (free) products to provide some similar mapping capabilities(and then some). The tool which provides the scrolling and "slippy" map features is called OpenLayers which reads in map imagery from OpenStreetMap. What I've done this time, however, is built the extension to read in KML files for the regions. KML is a format that is very common in the industry (Google Earth uses and creates the files) ,and there are many tools out there to convert other formats (like shape files) into the KML format.
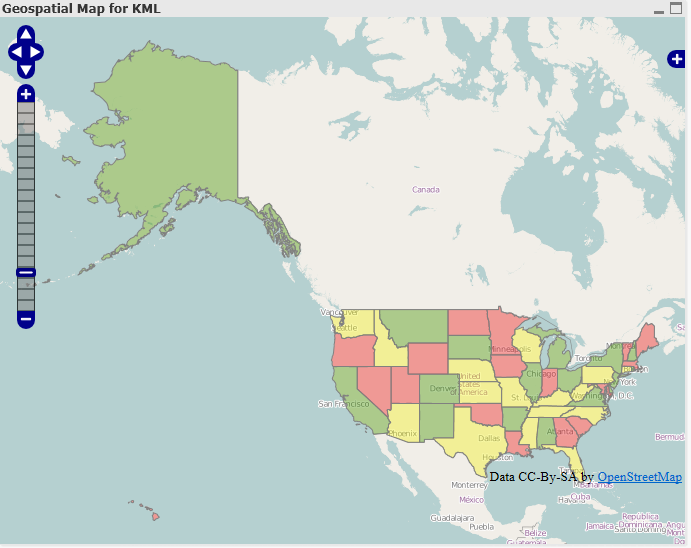
So, for example, I went and found a KML file for the US 50 states and put it into this new extension, and was able to create a map similar to my other US Map extension:
New Features
Above and beyond the normal features of the extensions I created for Google, this extension provides a few new features:
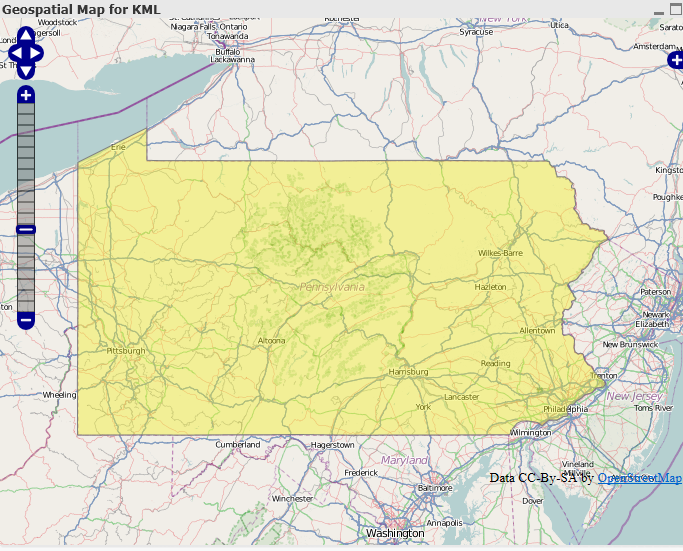
- No more setting the zoom and center point - In the other extensions, you had to set the default center point of the map as well as how far in it should be zoomed when it loads. In order to make the map more user friendly and intuitive, this extension automatically determines the center point of all of the regions and sets the window to show the whole map. This way, also, if you click on a region, the map window will only show the selected region:
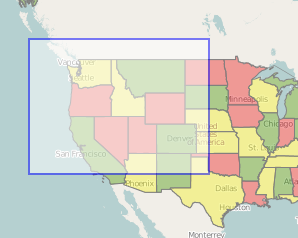
- Select Box -With this extension, if you hold down the shift key and drag an area with your mouse, a select box will appear, allowing you to select many regions at once:
Once the selection is made, the window will adjust itself to only show that region: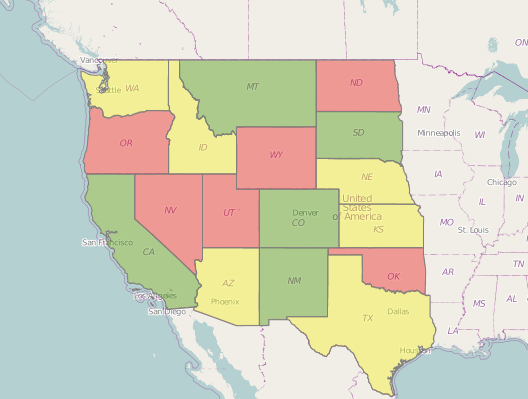
- Loading KML files - Loading KML files into the extension eliminates a lot of the manual work that was need for the other extensions. This way, as long as the KML names and QlikView dimension match up, KML files containing any kinds of regions can be used. So, for example, if a company has custom regions representing different sales regions, etc. in a KML file, it would be very easy to plug it into this extension.
- It's free- It uses open source technology so nobody will have to worry about licensing or being chased down by Google.
I've attached the extension as well as a QVW and quick guide. In the extension is a sample KML file called us_states.kml that can be used with the example QVW.
Please let me know if you have any questions. Hopefully this is useful to people.
UPDATE
Due to some issues with versions of Internet Explorer prior to 9 and how it handles different data formats, it is now necessary to change the KML file into an XML file prior to loading it into the extension. So, for example, if you have a KML named "counties.kml" you need to change the file extension so it becomes "counties.xml". Hopefully I'll eventually get time so this last step can be avoided, but for now it's necessary in order for the extension to work in IE8.
I've updated the attatchments on this post to use an XML file, so the examples should now work.
- Mark as New
- Bookmark
- Subscribe
- Mute
- Subscribe to RSS Feed
- Permalink
- Report Inappropriate Content
A floorplan sounds more like a candidate for Brian's SVG extension.
You can get that here: brianwmunz/svgReader-QV11 · GitHub
- Mark as New
- Bookmark
- Subscribe
- Mute
- Subscribe to RSS Feed
- Permalink
- Report Inappropriate Content
Brian
Is it possible to have different measures for a KML layer and for a points/lines layer?
I would like to show KPI performance as the colouring of the KML placemarks and then constant sized dots showing all the activities.
- Mark as New
- Bookmark
- Subscribe
- Mute
- Subscribe to RSS Feed
- Permalink
- Report Inappropriate Content
Hola Borja,
Estoy intentando implementar esta extensión con el mapa de Cataluña tal y como tu has hecho pero no lo consigo. Me he bajado y retocado varios kmls pero no hay manera.
¿Podrias decirme dónde has encontrado este kml? o bien, ¿podrias pasarme el kml que has utilizado?
Muchas gracias.
- Mark as New
- Bookmark
- Subscribe
- Mute
- Subscribe to RSS Feed
- Permalink
- Report Inappropriate Content
Hi Brian,
We've used the extension in one of our projects. In local works fine but when we installed the extension in our public server (on the cloud) the map don't work.
In conversations with our hosting administrator, he told us that the problem seems to be related with the use of "http" protocol instead of "https" and they can't change it for security police reasons.
Can you help us in someway?
Thanks
Jordi
- Mark as New
- Bookmark
- Subscribe
- Mute
- Subscribe to RSS Feed
- Permalink
- Report Inappropriate Content
Hi Brian,
Thank you very much for the map!
I have 2 questions:
1. Is it possible to enlarge the map window so that the map itself will have a bigger size?
2. Are there any other options for presenting data on the map (like markers or values), except for coloring it?
Thank you 
- Mark as New
- Bookmark
- Subscribe
- Mute
- Subscribe to RSS Feed
- Permalink
- Report Inappropriate Content
1) The map will scale to fit the size of the frame. If the map seems very 'zoomed-out' you may have some bad data that is plotting a shape/dot where you dont expect it.
2) You can have dots and shapes on the same map. To add dots you need to add a second dimension with longlat pairs. The problem is that they are linked to the same primary dimension and measure so having both shapes and dots is kind of redundant. What I think you are after is more of a multi-layer object like GeoQlik, but even that has its own issues.
- Mark as New
- Bookmark
- Subscribe
- Mute
- Subscribe to RSS Feed
- Permalink
- Report Inappropriate Content
Hi Brian,
Tried installing with v11.2 SR6 desktop. The QAR file is just locking up QlikView; wish I could tell you more...
Lonny
Brian Munz wrote:
Before going any further, I'd suggest you download the latest version of this. I combined this map with one of my other maps and began storing it on github. YOu can download it with the "download ZIP" button:
- Mark as New
- Bookmark
- Subscribe
- Mute
- Subscribe to RSS Feed
- Permalink
- Report Inappropriate Content
I ran into this problem recently with a client running SR7. I could not identify the problem. The solution I used was to replace the .qar with .zip. The zip file can then be manually extracted into your object extensions folder.
- Mark as New
- Bookmark
- Subscribe
- Mute
- Subscribe to RSS Feed
- Permalink
- Report Inappropriate Content
Hello Francesco
I too is facing the same issue, can you able to fix it and let me guide what you done for fix
- Mark as New
- Bookmark
- Subscribe
- Mute
- Subscribe to RSS Feed
- Permalink
- Report Inappropriate Content
i could not able to find the txt file called US State.txt which is loading data at the script level. can you kindly attach some where here