Unlock a world of possibilities! Login now and discover the exclusive benefits awaiting you.
- Qlik Community
- :
- All Forums
- :
- QlikView Integrations
- :
- Re: Visualization of Graph Data
- Subscribe to RSS Feed
- Mark Topic as New
- Mark Topic as Read
- Float this Topic for Current User
- Bookmark
- Subscribe
- Mute
- Printer Friendly Page
- Mark as New
- Bookmark
- Subscribe
- Mute
- Subscribe to RSS Feed
- Permalink
- Report Inappropriate Content
Visualization of Graph Data
Hi all,
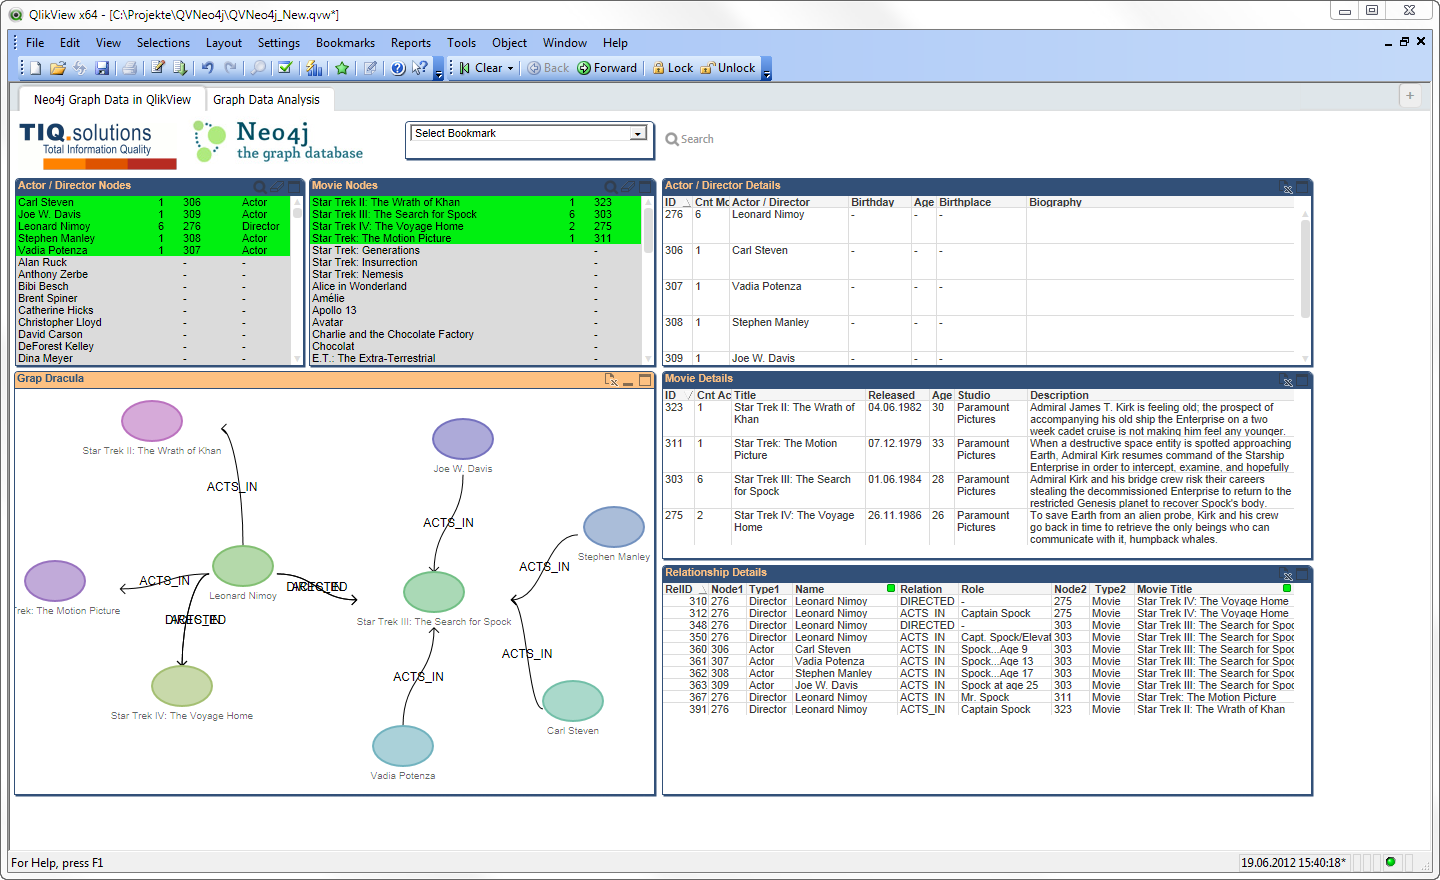
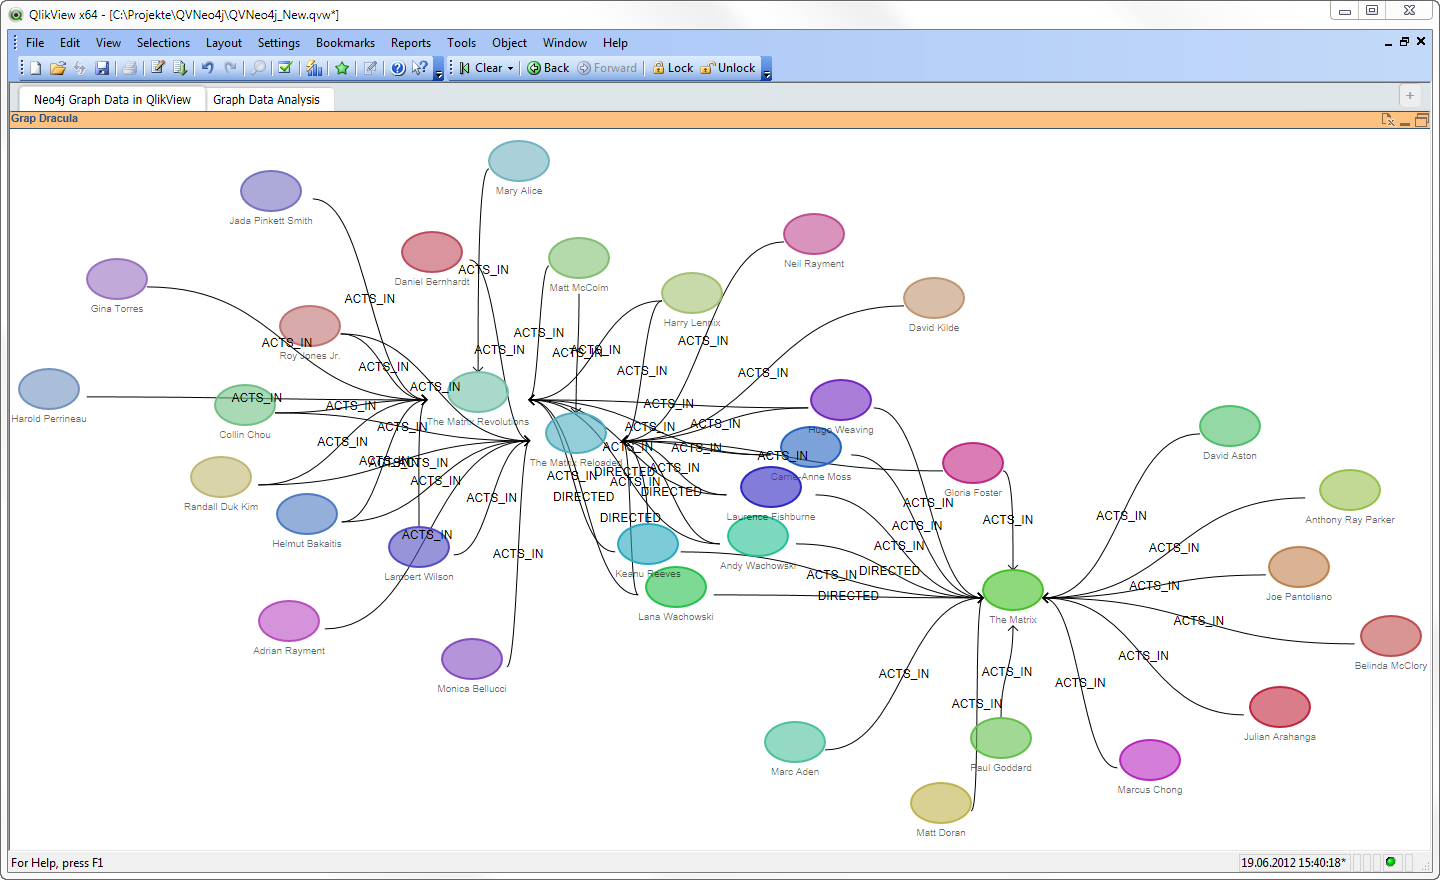
I started to develop an extension for graph visualization based on the Graph Dracula Library, using Raphael: http://www.graphdracula.net
This seems to be an interesting topic. First of all, what is the best data representation of graph data in a relational QlikView world? Second, there are a lot of limitations using those JavaScript libs. I've tried some before (D3.js etc.) but Dracula seems to have the simplest interface for my use case.
What is your opinion?
- Ralf


- Mark as New
- Bookmark
- Subscribe
- Mute
- Subscribe to RSS Feed
- Permalink
- Report Inappropriate Content
Is there a way to change label colours ?
I'v tried to change it via CSS, but i cant do it.
Any help ?
- Mark as New
- Bookmark
- Subscribe
- Mute
- Subscribe to RSS Feed
- Permalink
- Report Inappropriate Content
Hi Telmo,
since this is SVG you need to use the "fill" attribute like in this example:
g.addEdge(row[0].text, row[1].text, {
directed: true,
label: relLabel ? row[4].text.replace("\\n", "\n") : '',
"stroke": edgeColor ? row[9].text : '#aaaaaa',
"label-style": { "font-size": 12, "fill": "blue" }
});
- Ralf
- Mark as New
- Bookmark
- Subscribe
- Mute
- Subscribe to RSS Feed
- Permalink
- Report Inappropriate Content
It works with edges. Thanks.
But i'm having dificulties put it to work on PARENT and CHILD nodes. Any clue ?
nodes.push(g.addNode(row[0].text, {
label: parentLabel ? row[2].text.replace("\\n", "\n") : null,
size: parentSize ? row[5].data : 30,
tooltip: parentTooltip ? row[10].text.replace("\\n", "\r\n") : null,
stroke: (parentColor) ? row[7].text : 'rgb(100,100,100)',
fill: (parentColor) ? row[7].text : 'rgb(100,100,100)',
column: 0,
"label-style": { "font-size": 12, "fill": "green" }
}));
It look like something is changing label-style or some kind o attribute at draw runtime.
- Mark as New
- Bookmark
- Subscribe
- Mute
- Subscribe to RSS Feed
- Permalink
- Report Inappropriate Content
You can create a node render function. Within this you can change anything for the node's ellipse and text:
var render = function(r, n) {
var set = r.set().
push(r.ellipse(n.point[0], n.point[1], n.size * 1.5, n.size).attr({fill: n.fill, stroke: n.stroke, "stroke-width": 2})).
push(r.text(n.point[0], n.point[1] + n.size * 1.5, n.label || n.id).attr(n["label-style"]));
return set;
};
for (var i = 0, k = _this.Data.Rows.length; i < k; i++) {
var row = _this.Data.Rows;
if (row[1].value || false) {
g.addNode(row[1].text, {
label: childLabel ? row[3].text.replace("\\n", "\n") : null,
size: childSize ? row[6].data : 30,
tooltip: childTooltip ? row[11].text.replace("\\n", "\r\n") : null,
stroke: (childColor) ? row[8].text : 'rgb(100,100,100)',
fill: (childColor) ? row[8].text : 'rgb(100,100,100)',
"label-style": { "font-size": 9, "fill": (childColor) ? row[8].text : 'rgb(100,100,100)' },
render: render,
column: 1
});
}
if (row[0].value || false) {
g.addNode(row[0].text, {
label: parentLabel ? row[2].text.replace("\\n", "\n") : null,
size: parentSize ? row[5].data : 30,
tooltip: parentTooltip ? row[10].text.replace("\\n", "\r\n") : null,
stroke: (parentColor) ? row[7].text : 'rgb(100,100,100)',
fill: (parentColor) ? row[7].text : 'rgb(100,100,100)',
"label-style": { "font-size": 9, "fill": (parentColor) ? row[7].text : 'rgb(100,100,100)' },
render: render,
column: 0
});
}
if ((row[0].value || false) && (row[1].value || false)) {
g.addEdge(row[0].text, row[1].text, {
directed: true,
label: relLabel ? row[4].text.replace("\\n", "\n") : '',
stroke: edgeColor ? row[9].text : '#aaaaaa',
"label-style": { "font-size": 9, "fill": edgeColor ? row[9].text : '#aaaaaa' }
});
}
};
Nice feature indeed.. Will add this to the exentsion.
- Mark as New
- Bookmark
- Subscribe
- Mute
- Subscribe to RSS Feed
- Permalink
- Report Inappropriate Content
Thanks. it do the work. ![]()
- Mark as New
- Bookmark
- Subscribe
- Mute
- Subscribe to RSS Feed
- Permalink
- Report Inappropriate Content
Hi Ralph,
Is there any way to select multiple nodes so that I can focus on a certain cluster?
Thanks, Karl
- Mark as New
- Bookmark
- Subscribe
- Mute
- Subscribe to RSS Feed
- Permalink
- Report Inappropriate Content
Hi Karl,
there is but probably not the way you need it. My recent work is focussing more on the vis.js network chart where things are more easy to implement. But it's still complex and also data related. To make it right, I suggest a customizing or project work.
- Ralf
- Mark as New
- Bookmark
- Subscribe
- Mute
- Subscribe to RSS Feed
- Permalink
- Report Inappropriate Content
That would be a great addition. For now I used both charts to analyze cross-selling between customers belonging to the same segment that is predefined in the database. The sigma chart looks like it is the best option for that type of analysis. The dracula chart looks like a great way to show how customers are grouped by their purchase behavior instead of by their predefined segmentation, but I know the user is going to want to be able to select those nodes that are clustered together. We'll see what the user thinks.
Great extensions, great job Ralf.
Best, Karl
- Mark as New
- Bookmark
- Subscribe
- Mute
- Subscribe to RSS Feed
- Permalink
- Report Inappropriate Content
Could you send me a screenshot? Would like to see your use case and how you did it.
With my new Sigma.js and Vis.js Qlik Sense extensions I'm running a different data model and JavaScript aggregations where I can process selection of connected 1st and 2nd level nodes. There are also graph algorithms I could use to combine strong connected nodes or else. There is a lot more we could do here but as I said it's very use case / data related. And a lot of work..
- Ralf
- Mark as New
- Bookmark
- Subscribe
- Mute
- Subscribe to RSS Feed
- Permalink
- Report Inappropriate Content
Hi Ralf
This questions relates to one of your other builds (Icon Graph). What is it that I put in the Node Type prefixes that will allow me to change the style of the node?

Thanks
Peter