Unlock a world of possibilities! Login now and discover the exclusive benefits awaiting you.
- Qlik Community
- :
- All Forums
- :
- QlikView Integrations
- :
- Re: Visualization of Graph Data
- Subscribe to RSS Feed
- Mark Topic as New
- Mark Topic as Read
- Float this Topic for Current User
- Bookmark
- Subscribe
- Mute
- Printer Friendly Page
- Mark as New
- Bookmark
- Subscribe
- Mute
- Subscribe to RSS Feed
- Permalink
- Report Inappropriate Content
Visualization of Graph Data
Hi all,
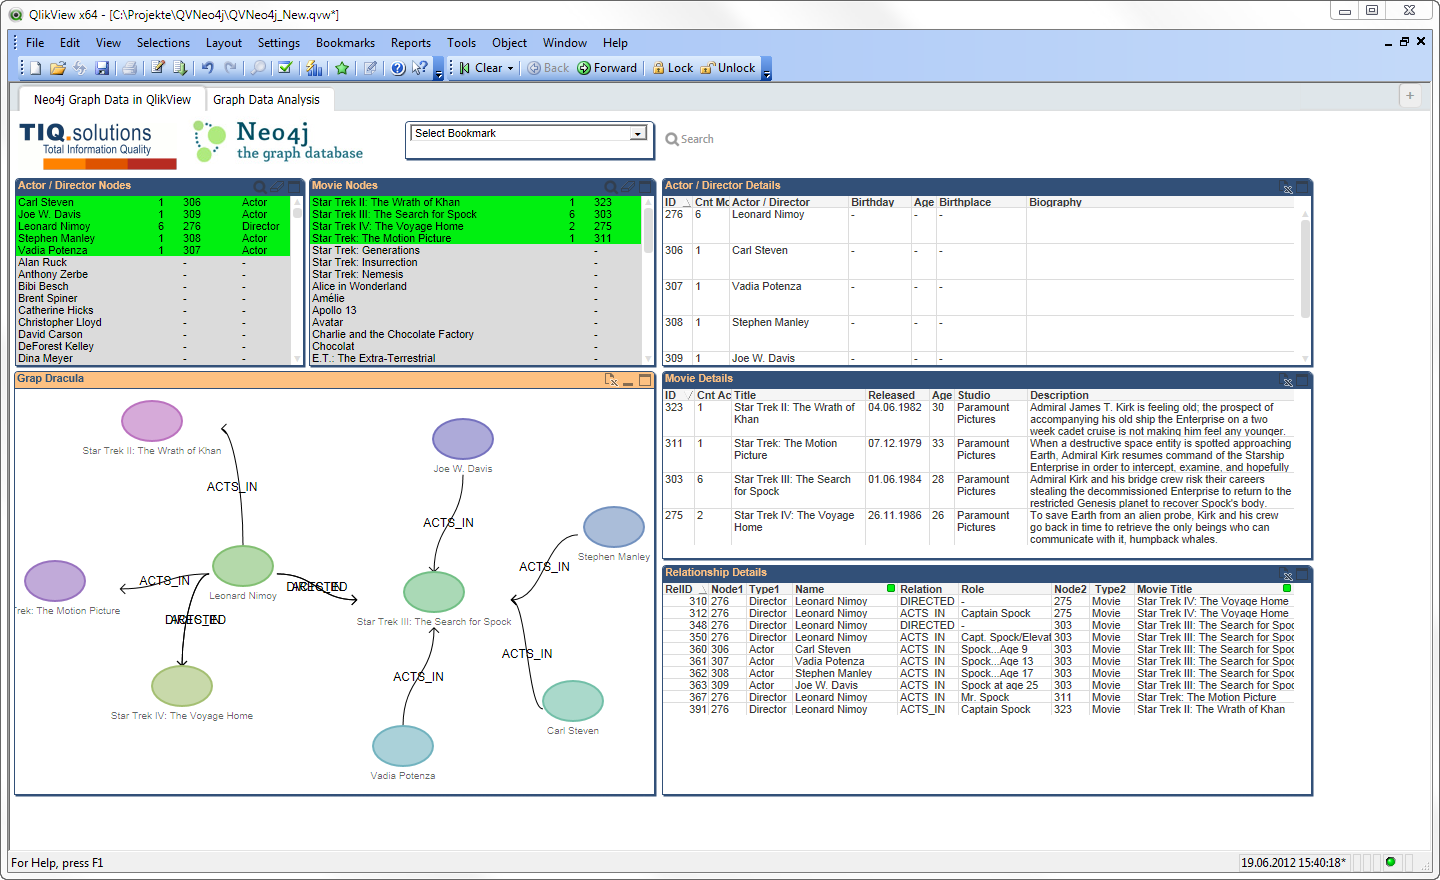
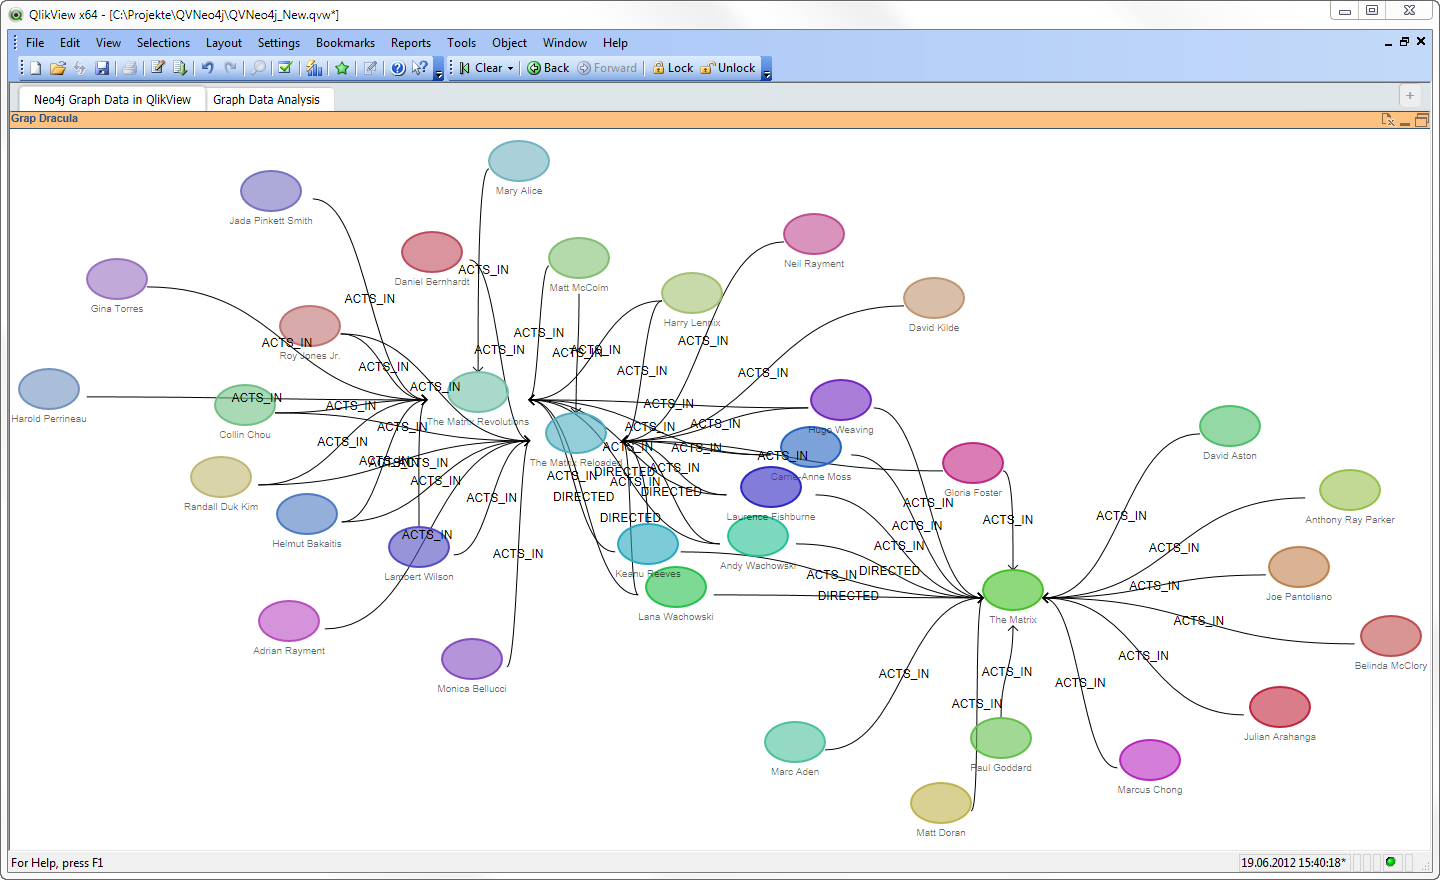
I started to develop an extension for graph visualization based on the Graph Dracula Library, using Raphael: http://www.graphdracula.net
This seems to be an interesting topic. First of all, what is the best data representation of graph data in a relational QlikView world? Second, there are a lot of limitations using those JavaScript libs. I've tried some before (D3.js etc.) but Dracula seems to have the simplest interface for my use case.
What is your opinion?
- Ralf


- Mark as New
- Bookmark
- Subscribe
- Mute
- Subscribe to RSS Feed
- Permalink
- Report Inappropriate Content
Hi Peter,
if you have a look into the example app QvprGraph.qvw on the GuHub repo you will understand:
I need to distinguish the type of the node to assign a color and icon. You need to set the prefix in the data for the underlaying table (adjacency list of graph edges: Node1->Node2):
- Ralf
- Mark as New
- Bookmark
- Subscribe
- Mute
- Subscribe to RSS Feed
- Permalink
- Report Inappropriate Content
Ok thanks Ralf, makes sense, I will have a play with the data and try and get it working.
Peter
- Mark as New
- Bookmark
- Subscribe
- Mute
- Subscribe to RSS Feed
- Permalink
- Report Inappropriate Content
Ok, I can also provide customizations. In the moment I'm developing an extension which leverages graph algorithms like to find the shortest path between nodes (Dijkstra and others) for some cooler use cases then just a display of the network..
- Mark as New
- Bookmark
- Subscribe
- Mute
- Subscribe to RSS Feed
- Permalink
- Report Inappropriate Content
Hi ralf,
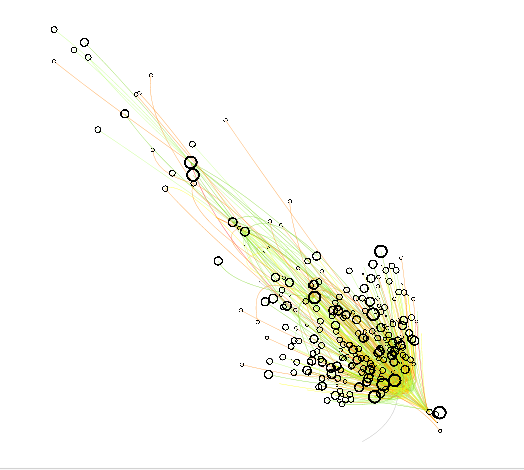
Sounds impressive. I am currently looking at a version of the Icon graph, with 1000 cases, wondering how the force directed part works? and also what the relationship is regarding the distance between nodes? Have you a force directed algorithm built into this version?

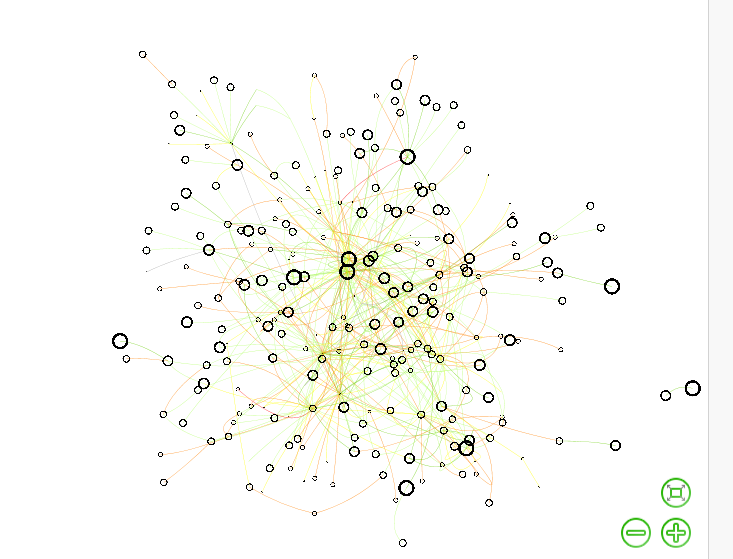
This is the complete set, when I hit the force button on top left the nodes begin to spread out of view, then after a few mins this is what im left with!

I have had to do a lot of scrolling around the chart to get to this point.
Thanks
Peter
- Mark as New
- Bookmark
- Subscribe
- Mute
- Subscribe to RSS Feed
- Permalink
- Report Inappropriate Content
There are some navigation buttons where you cn bring in the whole chart into view. No need for scrolling.
For the rendering, we could use different physical options, there is also ForceAtlas2: http://visjs.org/docs/network/physics.html
But there is no edge weight or else use. This all can be done as customizing on project level...
- Mark as New
- Bookmark
- Subscribe
- Mute
- Subscribe to RSS Feed
- Permalink
- Report Inappropriate Content
Hi Ralf,
Thanks for the wonderful extension!!!
Just curious to know, Can we have multiple node in Dracula chart.
Suppose I have 4 Level hierarchical data Level1,Level2,Level3,Level4.
so, If I click on Level1,my Parent Node will be Level1 and child would be Level2.
If I further click on Level2, my Parent Node will be Level2 and child node would be Level3, and so on.
Can I have level by level drill down of data.
Thanks in Advance.
- Mark as New
- Bookmark
- Subscribe
- Mute
- Subscribe to RSS Feed
- Permalink
- Report Inappropriate Content
Hi Priyanka,
this is not possible. A graph is not a hierarchy. Although, a hierarchy is a special graph 😉
At least for visualization you could concatenate load all relations into the adjacency list Node1->Node2:
AdjList:
Load Level1 as Node1, Level2 as Node2, ..;
concatenate
Load Level2 as Node1, Level3 as Node2, ..;
concatenate
Load Level3 as Node1, Level4 as Node2, ..;
- Ralf
- Mark as New
- Bookmark
- Subscribe
- Mute
- Subscribe to RSS Feed
- Permalink
- Report Inappropriate Content
Hi Ralf,
Do you working graph data with Qlik Sense? Because i really need an example about this visualization, the extension and the data sample, do you have any? Thank you ![]()
Regards
Win
- Mark as New
- Bookmark
- Subscribe
- Mute
- Subscribe to RSS Feed
- Permalink
- Report Inappropriate Content
Hi Winprins,
I have a few working examples and extensions for Qlik Sense, too. I showed some at conferences like Qonnections this year and several Neo4j meetups.
However, this is all use case oriented and I do not have published these exapmles so far. To get a successful working implementation you need to work it out in a project context. That's why I do not post much examples anymore. Because I wouldn't find any sleep answering all questions and requests about..
Just involve the right people into the project to make things work..
Best,
Ralf
- Mark as New
- Bookmark
- Subscribe
- Mute
- Subscribe to RSS Feed
- Permalink
- Report Inappropriate Content
Hi Ralf,
Actually i've tried to provide the data with Neo4j in qlikview and , but currently i'm moving on to qlik sense and trying to visualize the same graph in qlikview with qliksense,
would you please help me with your qlik sense graph ext?
Regards
Winprins