Unlock a world of possibilities! Login now and discover the exclusive benefits awaiting you.
- Qlik Community
- :
- All Forums
- :
- QlikView Integrations
- :
- Re: Visualization of Graph Data
- Subscribe to RSS Feed
- Mark Topic as New
- Mark Topic as Read
- Float this Topic for Current User
- Bookmark
- Subscribe
- Mute
- Printer Friendly Page
- Mark as New
- Bookmark
- Subscribe
- Mute
- Subscribe to RSS Feed
- Permalink
- Report Inappropriate Content
Visualization of Graph Data
Hi all,
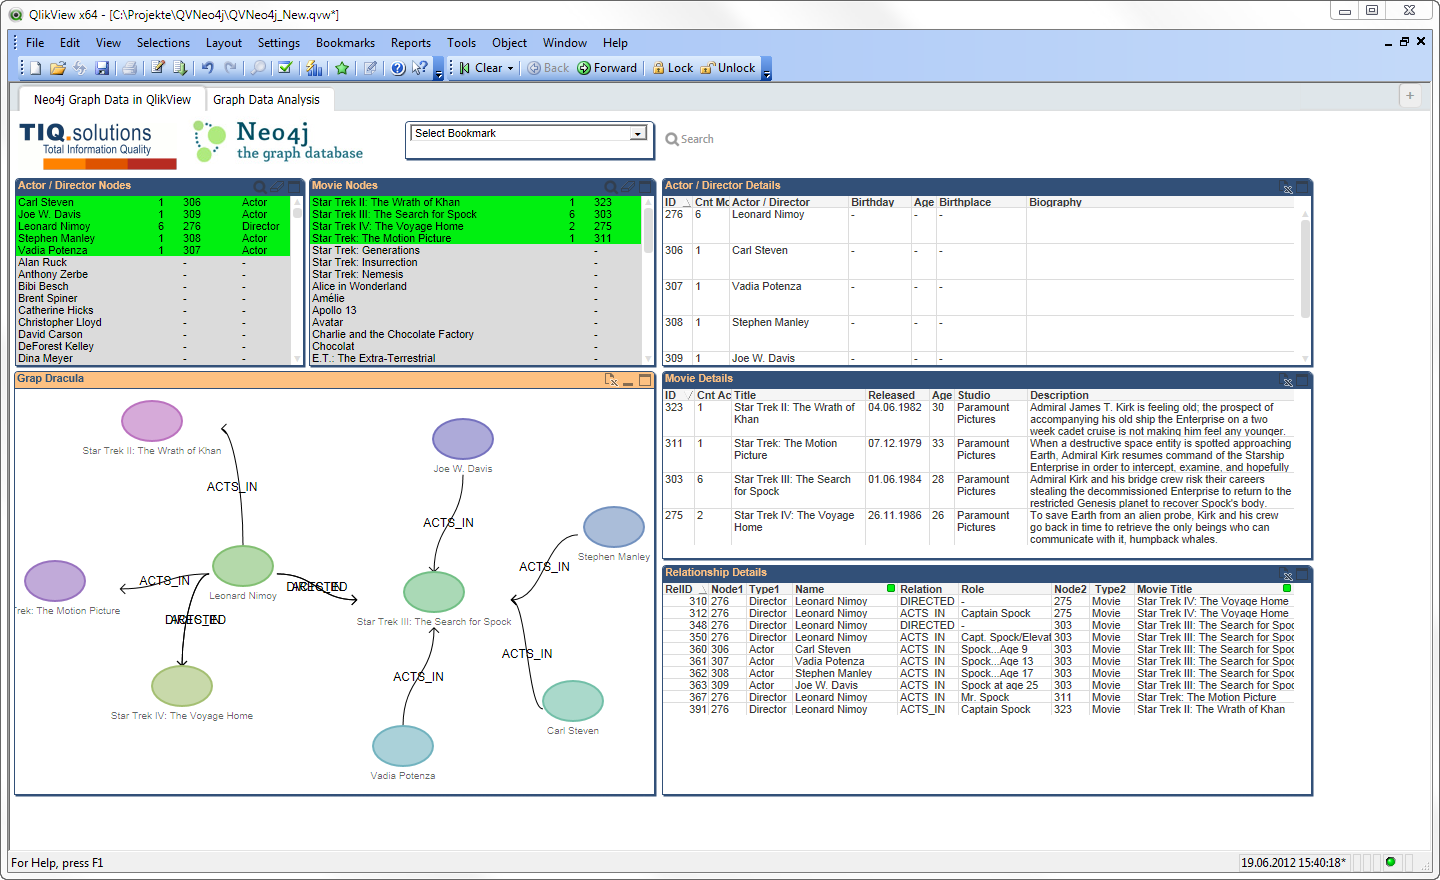
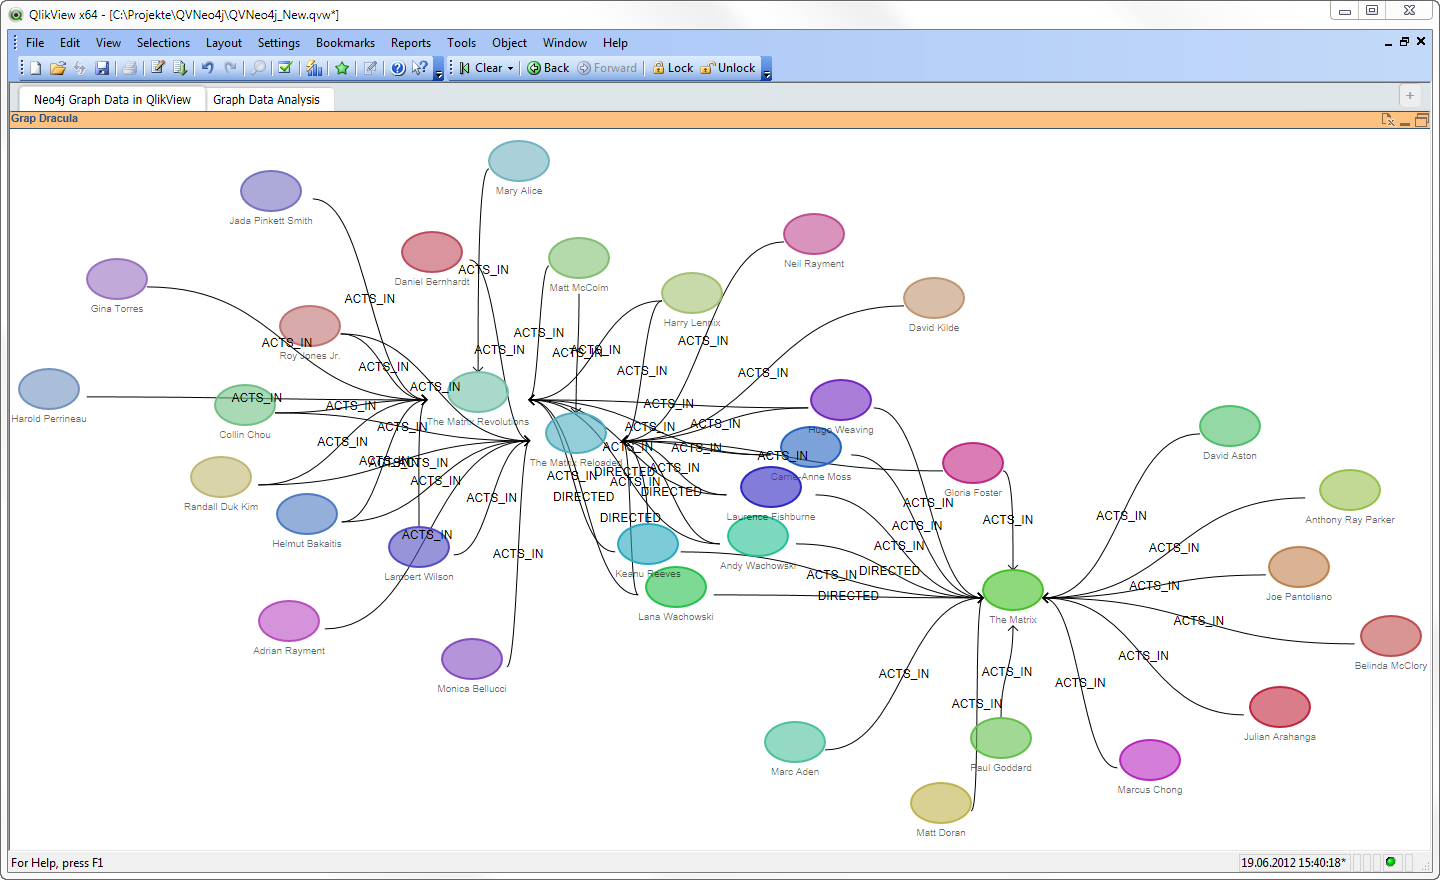
I started to develop an extension for graph visualization based on the Graph Dracula Library, using Raphael: http://www.graphdracula.net
This seems to be an interesting topic. First of all, what is the best data representation of graph data in a relational QlikView world? Second, there are a lot of limitations using those JavaScript libs. I've tried some before (D3.js etc.) but Dracula seems to have the simplest interface for my use case.
What is your opinion?
- Ralf


- Mark as New
- Bookmark
- Subscribe
- Mute
- Subscribe to RSS Feed
- Permalink
- Report Inappropriate Content
Hi Ralf,
Your extension is so good, is it possible to add following functionality to the extension.
We need to show job dependencies for showing its successor and predecessors like below.
Also when clicking on any of the Process it should become the center Process and its successor and predecessor should show.
Thanks a lot
- Mark as New
- Bookmark
- Subscribe
- Mute
- Subscribe to RSS Feed
- Permalink
- Report Inappropriate Content
Hi Fouzia,
I agree, this can be developed in any kind of direction.. We provide professional services for this kind of implementations.
- Ralf
- Mark as New
- Bookmark
- Subscribe
- Mute
- Subscribe to RSS Feed
- Permalink
- Report Inappropriate Content
As i request from LinkedIn - I would need this? https://gojs.net/latest/samples/PathAnimation.html
Can we achieve this? Please let s know if some one contribute on my post
Note - I apologies for posting thru old thread. But we need input like link i attached
- Mark as New
- Bookmark
- Subscribe
- Mute
- Subscribe to RSS Feed
- Permalink
- Report Inappropriate Content
Sure, just create another graph extension and use GoJS library instead. Easy as this..
- Mark as New
- Bookmark
- Subscribe
- Mute
- Subscribe to RSS Feed
- Permalink
- Report Inappropriate Content
If you have time, Can you provide - QVW for that too.
- Mark as New
- Bookmark
- Subscribe
- Mute
- Subscribe to RSS Feed
- Permalink
- Report Inappropriate Content
You can order professional services from us for this kind of development.
- Mark as New
- Bookmark
- Subscribe
- Mute
- Subscribe to RSS Feed
- Permalink
- Report Inappropriate Content
Hi Ralf,
Do you have anything similar for Qlik sense?
Thanks,
Jill
- Mark as New
- Bookmark
- Subscribe
- Mute
- Subscribe to RSS Feed
- Permalink
- Report Inappropriate Content
Hi Jill,
we have a couple of commercial and supported graph extensions. Please contact me directly if you're interested:
- Ralf
- Mark as New
- Bookmark
- Subscribe
- Mute
- Subscribe to RSS Feed
- Permalink
- Report Inappropriate Content
Ralf,
Great app. It worked perfectly.
- Mark as New
- Bookmark
- Subscribe
- Mute
- Subscribe to RSS Feed
- Permalink
- Report Inappropriate Content
Hi Ralf,
Sorry to posting message here . I have urgent requirement is to create a straight Line Network topology diagram in QlikSense. I want to show the Nodes connected with straight line like E1,E2 ,E3 is connected in between cables T1, T2 and so on. Please suggest me or any pointers for this type of requirement to be achievable in QlikSense. Below is thread where I have posted my requirement.
https://community.qlik.com/t5/forums/editpage/board-id/qlik-sense-app-development/message-id/42649
Thanks.
Deepak