Unlock a world of possibilities! Login now and discover the exclusive benefits awaiting you.
- Qlik Community
- :
- All Forums
- :
- QlikView Integrations
- :
- Word Cloud Object Extension
- Subscribe to RSS Feed
- Mark Topic as New
- Mark Topic as Read
- Float this Topic for Current User
- Bookmark
- Subscribe
- Mute
- Printer Friendly Page
- Mark as New
- Bookmark
- Subscribe
- Mute
- Subscribe to RSS Feed
- Permalink
- Report Inappropriate Content
Word Cloud Object Extension
A new app for the US Presidential election is being released on the QlikView Demo Site shortly, and it contains an extension for a word cloud that might be useful. It's built using this word cloud generation javascript library (built on the d3 JS library) which attempted to simulate the look and feel of Wordle:

I don't use all of the options available in this library and keep it pretty bare bones, but I imagine this extension should satisfy most use cases.
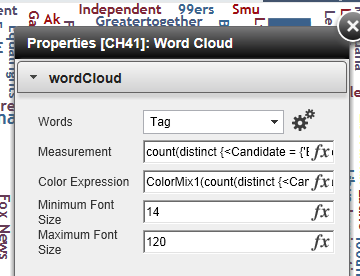
The properties are fairly straightforward:

The Words dimension is simply the list of words that will be displayed in the cloud
Measurement is an expression which controls the sizes of the words. This could be anything you'd like to measure the words against.
Color Expression is the expression which controls the color of the words. If you simply want one color, you could hardcode it to a hex or RGB color, or you could use an expression and mix two colors (using the ColorMix1 function from QlikView), or use the expression like a gauge and present any number of colors based on some range.
The Maximum Font Size and Minimum Font Size properties are simply the maximum and minimum sizes of the words.
SOME THINGS TO NOTE:
The cloud can be a bit unwieldly (or maybe crash) if you pass too many words into it, so I've set a maximum data set of 700 for this extension. To change this, edit the Definition.xml file in the extension's folder and change 700 to whatever you want in this line:
<ExtensionObject Label="wordCloud" Description="wordCloud" PageHeight="700">
The only issue this might cause is if you have 1000 words in the dimension, a random selection of 700 will be passed in, in no particular order. I've tried and tried to get the extension to sort based on the expression rather than the dimension and I think it's not possible (which may be a bug), so instead returning the top x number of words based on an expression might need to be done using set analysis, firstsortvalue, or ranking function.
I think that's it. Let me know if you run into any problems.
EDIT
I now host this extension on GitHub.
brianwmunz/wordCloud-QV11 · GitHub
Please download it from there form now on. Also, feel free to update, change, improve, etc. the extension in any way you please using GitHub.
Thanks.
- « Previous Replies
- Next Replies »
- Mark as New
- Bookmark
- Subscribe
- Mute
- Subscribe to RSS Feed
- Permalink
- Report Inappropriate Content
Hi Sabi,
If I understand correctly you want the onclick-event to select not only values in the dimension that correspond exactly with the word that was clicked on ( = value), but you want to select any value in the dimension that contains the word that was clicked on (like *value*).
This can easily be done with a small modification to the extension script.If you go to the extension folder (probably C:\Users\username\AppData\Local\QlikTech\QlikView\Extensions\Objects\wordCloud), you will find the file Script.js. Open this in any text editor.
Then change row 82 from:
_this.Data.SearchColumn(0, d.text);
to:
_this.Data.SearchColumn(0, "*" + d.text + "*");
Save Script.js, refresh your Qlikview document and it should have the behavior you are looking for.
Regards,
Koen
- Mark as New
- Bookmark
- Subscribe
- Mute
- Subscribe to RSS Feed
- Permalink
- Report Inappropriate Content
Hey Koen van Stek,
thank u for ur replying. Yeah, especially i want, that if i click on a value, i want to see the notes, which contains this value. (With notes i mean the annotations, which you can make, if u run Qlikview on a Server live! 🙂 - Here a link what i mean with notes: QlikView 11 Notes and Annotations - Empowering Users - YouTube)
I hope you can understand what i mean.
But thank u, i will try, if it is possible with this code. 🙂
Thank u very much. 🙂
- Mark as New
- Bookmark
- Subscribe
- Mute
- Subscribe to RSS Feed
- Permalink
- Report Inappropriate Content
Hi Sabi,
I am not sure this is possible. If I understand correctly, notes are created on an object-level. This means that they are not in the datamodel itself per se, so I do not know if (and do not think) it is possible to call these with an extension object.
Regards,
Koen
- Mark as New
- Bookmark
- Subscribe
- Mute
- Subscribe to RSS Feed
- Permalink
- Report Inappropriate Content
Okey, thank u for ur help. 🙂
One last question: I have a table with two values.
Table
A | B
Name | Value
Name2 | Value
Name3 | Value
Now i want to show only the top 40 Names with the highest value - i have no idea how i can do this. The table is loaded via an excel-sheet, where i have ~ 200 data sets.
- « Previous Replies
- Next Replies »