Unlock a world of possibilities! Login now and discover the exclusive benefits awaiting you.
- Qlik Community
- :
- All Forums
- :
- QlikView App Dev
- :
- Calculate Averages in set analysis
- Subscribe to RSS Feed
- Mark Topic as New
- Mark Topic as Read
- Float this Topic for Current User
- Bookmark
- Subscribe
- Mute
- Printer Friendly Page
- Mark as New
- Bookmark
- Subscribe
- Mute
- Subscribe to RSS Feed
- Permalink
- Report Inappropriate Content
Calculate Averages in set analysis
Good morning,
I am trying to calculate averages for the attached file. The formula I have used to calculate
Total_PreviewTime=Sum ({<PreviewedFirst={1}>}PreviewTime) and I want to calculate the Average Total_PreviewTime and similarly for
Total_CallTime=sum(CallTime) I want to calculate Average Total_CallTime
PFA,
Thanks
- « Previous Replies
-
- 1
- 2
- Next Replies »
Accepted Solutions
- Mark as New
- Bookmark
- Subscribe
- Mute
- Subscribe to RSS Feed
- Permalink
- Report Inappropriate Content
Hi Moses,
you can try
Aggr(Sum ({<PreviewedFirst={1}>}PreviewTime),Dim1,Dim2,Dim3) / Count ({<PreviewedFirst={1}>}PreviewTime)
- Mark as New
- Bookmark
- Subscribe
- Mute
- Subscribe to RSS Feed
- Permalink
- Report Inappropriate Content
What about
Avg({<PreviewedFirst={1}>}PreviewTime)
and
Avg({<Total_CallTime={1}>}Total_CallTime)
- Mark as New
- Bookmark
- Subscribe
- Mute
- Subscribe to RSS Feed
- Permalink
- Report Inappropriate Content
Hi Manish,
I am actually looking for the Average of Sum ({<PreviewedFirst={1}>}PreviewTime), if there is something like
avg(Sum ({<PreviewedFirst={1}>}PreviewTime)). Not sure if this is possible
Thanks
- Mark as New
- Bookmark
- Subscribe
- Mute
- Subscribe to RSS Feed
- Permalink
- Report Inappropriate Content
You can try something like:
avg(Aggr(Sum ({<PreviewedFirst={1}>}PreviewTime), Dim1))
Where Dim1 is dimension(s) on which the aggregation is desired.
- Mark as New
- Bookmark
- Subscribe
- Mute
- Subscribe to RSS Feed
- Permalink
- Report Inappropriate Content
May be something like this:
Avg(Aggr(Sum({<PreviewedFirst={1}>}PreviewTime), CallCentre, Desk, Team_Lead, Agent_Name, Day))
- Mark as New
- Bookmark
- Subscribe
- Mute
- Subscribe to RSS Feed
- Permalink
- Report Inappropriate Content
You need to use Aggr as per Tresesco;s reply..
Avg(Aggr(SUM(YourExpression),Dim1,Dim2,Dim3))
- Mark as New
- Bookmark
- Subscribe
- Mute
- Subscribe to RSS Feed
- Permalink
- Report Inappropriate Content
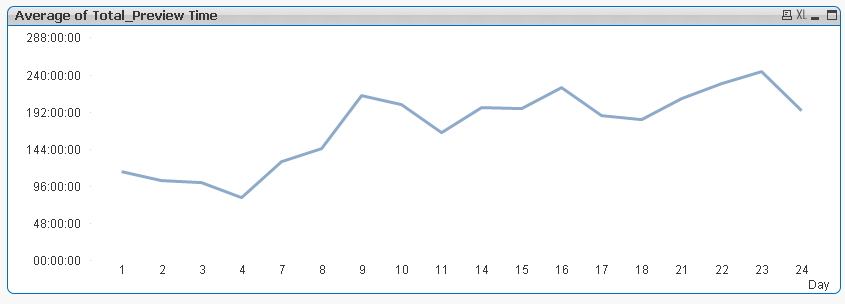
Thank you for the all the responses, when I use this =Avg(aggr(Sum ({<PreviewedFirst={1}>}PreviewTime),Day)) and I use Interval format (hh:mm:ss) and my graph comes like
- Mark as New
- Bookmark
- Subscribe
- Mute
- Subscribe to RSS Feed
- Permalink
- Report Inappropriate Content
So this is not what you are looking to do? What is your expected output here?
- Mark as New
- Bookmark
- Subscribe
- Mute
- Subscribe to RSS Feed
- Permalink
- Report Inappropriate Content
You probably need same average across days, if so try like:
=Avg(Total aggr(Sum ({<PreviewedFirst={1}>}PreviewTime),Day))
- Mark as New
- Bookmark
- Subscribe
- Mute
- Subscribe to RSS Feed
- Permalink
- Report Inappropriate Content
Hi Sunny T,
The formula is fine but now when I put on the line graph, the I select the format of Interval hh:mm:ss is not translating correctly. I am expecting the time intervals of 00:00:00 to 00:30:00
thanks
- « Previous Replies
-
- 1
- 2
- Next Replies »