Unlock a world of possibilities! Login now and discover the exclusive benefits awaiting you.
- Qlik Community
- :
- All Forums
- :
- QlikView App Dev
- :
- Chart colours (colors) with selections
- Subscribe to RSS Feed
- Mark Topic as New
- Mark Topic as Read
- Float this Topic for Current User
- Bookmark
- Subscribe
- Mute
- Printer Friendly Page
- Mark as New
- Bookmark
- Subscribe
- Mute
- Subscribe to RSS Feed
- Permalink
- Report Inappropriate Content
Chart colours (colors) with selections
Hi Everyone,
I have recreated a problem I'm consistently having to workaround. Wondering if anyone has a way of fixing this.
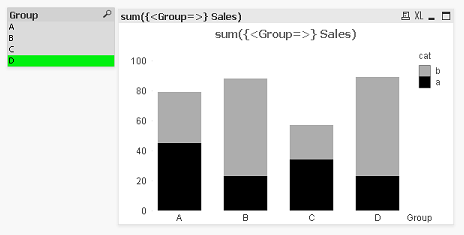
In the attached example you will see that I have set colours for my cat dimension as grey and black (using an expression). I also need the chart to remain static even with a selection on Group. However, when I make a selection on Group, the colours revert to the default. I'm assuming this is because I have essentially filtered out the data that sits behind these Groups, therefore no cat, therefore no colours.
Anyone got any ideas?
Thanks in advance.
Gareth
Accepted Solutions
- Mark as New
- Bookmark
- Subscribe
- Mute
- Subscribe to RSS Feed
- Permalink
- Report Inappropriate Content
You can achieve this by ignoring all selections in your colour expression, using Set Analysis. The expression should read:
=if(maxstring({1}cat)='a', rgb(23,23,23)
,if(maxstring({1}cat)='b', rgb(187,187,187)))
Hope this helps.
Steve
- Mark as New
- Bookmark
- Subscribe
- Mute
- Subscribe to RSS Feed
- Permalink
- Report Inappropriate Content
Might be missing something obvious here but:
Just set the colours under the 'colors' tab to be the black and grey you need. As you're using Set Analysis the order should never change.
Hope that helps (although I think there may be more to this!)
Matt - Visual Analytics Ltd
- Mark as New
- Bookmark
- Subscribe
- Mute
- Subscribe to RSS Feed
- Permalink
- Report Inappropriate Content
You can achieve this by ignoring all selections in your colour expression, using Set Analysis. The expression should read:
=if(maxstring({1}cat)='a', rgb(23,23,23)
,if(maxstring({1}cat)='b', rgb(187,187,187)))
Hope this helps.
Steve
- Mark as New
- Bookmark
- Subscribe
- Mute
- Subscribe to RSS Feed
- Permalink
- Report Inappropriate Content
Clever, thanks mate this worked a treat.
- Mark as New
- Bookmark
- Subscribe
- Mute
- Subscribe to RSS Feed
- Permalink
- Report Inappropriate Content
Hi All,
Nice answer i am looking for that it helpful.
Anand
- Mark as New
- Bookmark
- Subscribe
- Mute
- Subscribe to RSS Feed
- Permalink
- Report Inappropriate Content
Hi there - I had a requirement where the client wanted to specify specific RGB codes for each of the customer groups in their data. I did this by providing a spreadsheet to them with the client names and blank columns for the colour codes. Once this was populated it was pulled in and used, the code for it is a bit like what I have posted in this community thread:
http://community.qlik.com/message/128707#128707
Enjoy.
Steve