Unlock a world of possibilities! Login now and discover the exclusive benefits awaiting you.
- Qlik Community
- :
- All Forums
- :
- QlikView App Dev
- :
- Re: Combo Chart with no Dimensions only expression...
- Subscribe to RSS Feed
- Mark Topic as New
- Mark Topic as Read
- Float this Topic for Current User
- Bookmark
- Subscribe
- Mute
- Printer Friendly Page
- Mark as New
- Bookmark
- Subscribe
- Mute
- Subscribe to RSS Feed
- Permalink
- Report Inappropriate Content
Combo Chart with no Dimensions only expressions
Good Morning Qlik Community -
I'll try to explain this as best I can -
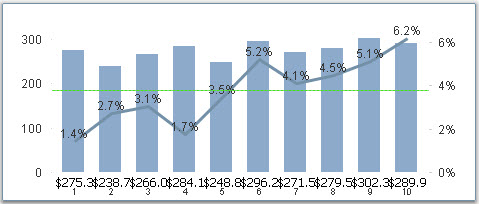
How do you effectively manage a combo chart when the data sourced is in multiple columns as opposed to rows. For example I have one row of data for supplier ABC and their period 1 parts data is in column B, their period 1 defects are in column C, and so on. How can I use a combo chart to show on bar for period one with the parts and use the line part of the combo chart to show the defects.
Image below is an example of what I'm trying to achieve and sample data is attached.
Thanks for your help with this.
Accepted Solutions
- Mark as New
- Bookmark
- Subscribe
- Mute
- Subscribe to RSS Feed
- Permalink
- Report Inappropriate Content
attached
- Mark as New
- Bookmark
- Subscribe
- Mute
- Subscribe to RSS Feed
- Permalink
- Report Inappropriate Content
Hi,
What is the dimension (under the bars) in the example ? Is it a period?
Thanks
- Mark as New
- Bookmark
- Subscribe
- Mute
- Subscribe to RSS Feed
- Permalink
- Report Inappropriate Content
Yes, I'm looking to have a Period 1, 2, 3, etc. as the dimension.
- Mark as New
- Bookmark
- Subscribe
- Mute
- Subscribe to RSS Feed
- Permalink
- Report Inappropriate Content
Hi,
I made an example, see if it solve your problem
- Mark as New
- Bookmark
- Subscribe
- Mute
- Subscribe to RSS Feed
- Permalink
- Report Inappropriate Content
attached
- Mark as New
- Bookmark
- Subscribe
- Mute
- Subscribe to RSS Feed
- Permalink
- Report Inappropriate Content
Thanks Mauri - that's what I'm looking for. Can you offer some explanation of some items please as I'm still a newbie to Qlik.....
1. Can you explain what CrossTable(Period, Data) does?
2. How do you populate Period....is it subfield(Period,' ',1) as Periodo if so how does it know there are only 3 periods?
3. Resident Teste; and Drop Table Teste can you offer some explanation on what these do/are for as well?
Thanks in advance for your solution -
- Mark as New
- Bookmark
- Subscribe
- Mute
- Subscribe to RSS Feed
- Permalink
- Report Inappropriate Content
1. Here is a explanation about CrossTable
The Crosstable Load
2.Subfield is a string function, so it's getting the characteres of field Period before space. You can see an better explanation and example serching for 'subfield' in qlikview's help
3. Resident - works as reload from a table that has already been loaded
Drop Table - delete table Teste
If the answer is correct, please mark the thread is correct to finish the thread