Unlock a world of possibilities! Login now and discover the exclusive benefits awaiting you.
- Qlik Community
- :
- All Forums
- :
- QlikView App Dev
- :
- Re: Does Qlik Support these types of charts and gr...
- Subscribe to RSS Feed
- Mark Topic as New
- Mark Topic as Read
- Float this Topic for Current User
- Bookmark
- Subscribe
- Mute
- Printer Friendly Page
- Mark as New
- Bookmark
- Subscribe
- Mute
- Subscribe to RSS Feed
- Permalink
- Report Inappropriate Content
Does Qlik Support these types of charts and graphs
Hi All,
I have been using Qlikview for a while now. I know I can build the charts and table he is requesting but does Qlikview support the color coding being done in these reports? I have not explored that piece yet.
Thanks,
David
- « Previous Replies
-
- 1
- 2
- Next Replies »
Accepted Solutions
- Mark as New
- Bookmark
- Subscribe
- Mute
- Subscribe to RSS Feed
- Permalink
- Report Inappropriate Content
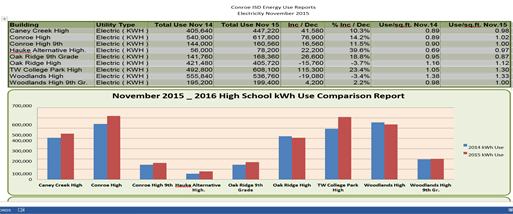
I have figured out the straight table coloring and thanks everyone for that. The problem I am now faced with is the clients chart looks like this:
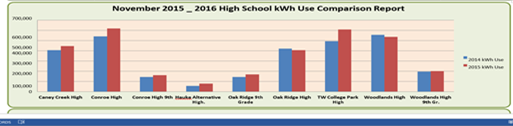
And Mind looks like this:

I am trying to figure out how to box in the area with a different color. You can see my clients is two toned. Green and a orange. Is there a way to do that?
- Mark as New
- Bookmark
- Subscribe
- Mute
- Subscribe to RSS Feed
- Permalink
- Report Inappropriate Content
Yes, you can color the charts in the way they they requested. Actually, the Straight Table colors resemble the Style "Pyjama Green".
In order to customize Straight Table cells, enable Design Grid, right-click on the cell and select Custom Design from the context menu. You will be able to set any colors from there.
Cheers,
Oleg Troyansky
Upgrade your Qlik skills at the Masters Summit for Qlik - coming soon to Milan, Italy!
- Mark as New
- Bookmark
- Subscribe
- Mute
- Subscribe to RSS Feed
- Permalink
- Report Inappropriate Content
Yes can you do custom color coding in the charts.
Can you please post sample data?
- Mark as New
- Bookmark
- Subscribe
- Mute
- Subscribe to RSS Feed
- Permalink
- Report Inappropriate Content
For the table chart, look into 'style' tab of your chart properties.
You can select several predefined styles (and AFAIR also add custom styles).
For the bar chart, it seems like a frame background color on 'Colors' tab of your chart properties should serve your needs.
- Mark as New
- Bookmark
- Subscribe
- Mute
- Subscribe to RSS Feed
- Permalink
- Report Inappropriate Content
Apart from the red underlining that should be no problem
talk is cheap, supply exceeds demand
- Mark as New
- Bookmark
- Subscribe
- Mute
- Subscribe to RSS Feed
- Permalink
- Report Inappropriate Content
I have figured out the straight table coloring and thanks everyone for that. The problem I am now faced with is the clients chart looks like this:
And Mind looks like this:
I am trying to figure out how to box in the area with a different color. You can see my clients is two toned. Green and a orange. Is there a way to do that?
- Mark as New
- Bookmark
- Subscribe
- Mute
- Subscribe to RSS Feed
- Permalink
- Report Inappropriate Content
I have figured out the straight table coloring and thanks everyone for that. The problem I am now faced with is the clients chart looks like this:

And Mind looks like this:

I am trying to figure out how to box in the area with the grid line a different color. You can see my clients is two toned. Green and a orange. Is there a way to do that?
- Mark as New
- Bookmark
- Subscribe
- Mute
- Subscribe to RSS Feed
- Permalink
- Report Inappropriate Content
I figured it out. Again thanks for the help.
- Mark as New
- Bookmark
- Subscribe
- Mute
- Subscribe to RSS Feed
- Permalink
- Report Inappropriate Content
In the Style tab, select Plot Area Background Style = Shadow, then in the Colors tab, you can select two different colors - "Background" and "Plot Area".
As a side comment - their requirement looks outdated, today we are minimizing the use of background colors and decorations, trying to focus users attention on the data and not on the embellishments. I'd try and educate the client on the principles of flat design... The same chart would look a lot better on a white background.
Cheers,
Oleg Troyansky
- Mark as New
- Bookmark
- Subscribe
- Mute
- Subscribe to RSS Feed
- Permalink
- Report Inappropriate Content
Thank you so much Oleg. I totally agree with you on the colors. I like to use colors but only in certain ways. You can do this type of coloring on a pivot table can you?
David
- « Previous Replies
-
- 1
- 2
- Next Replies »