Unlock a world of possibilities! Login now and discover the exclusive benefits awaiting you.
- Qlik Community
- :
- All Forums
- :
- QlikView App Dev
- :
- How to add a stand-alone row for a dimension in a ...
- Subscribe to RSS Feed
- Mark Topic as New
- Mark Topic as Read
- Float this Topic for Current User
- Bookmark
- Subscribe
- Mute
- Printer Friendly Page
- Mark as New
- Bookmark
- Subscribe
- Mute
- Subscribe to RSS Feed
- Permalink
- Report Inappropriate Content
How to add a stand-alone row for a dimension in a pivot table?
Hi,
Does anyone know if it's possible, and if so, how to add a "stand-alone" row for a dimension in a pivot table?
I want the pivot table to display data in a similar manner as below (with "stand-alone" rows I mean the rows 2, 3 and 8):
| Year | Quarter | Month | Day | Expression |
|---|---|---|---|---|
| 2015 | 255 | |||
| 2015 | Q1 | 12 | ||
| 2015 | Q1 | Jan | 1 | 8 |
| 2015 | Q1 | Jan | 2 | 7 |
| 2015 | Q1 | Feb | 1 | 9 |
| 2015 | Q1 | Mar | 1 | 5 |
| 2015 | Q2 | 45 | ||
| 2015 | Q2 | Apr | 1 | 5 |
| 2015 | Q2 | Apr | 2 | 5 |
| 2015 | Q2 | Apr | 3 | 8 |
The value 255 and the value 12 and 45 uses two other different expression than the rest in that column. Is this possible?
Thanks!
/Frida
Accepted Solutions
- Mark as New
- Bookmark
- Subscribe
- Mute
- Subscribe to RSS Feed
- Permalink
- Report Inappropriate Content
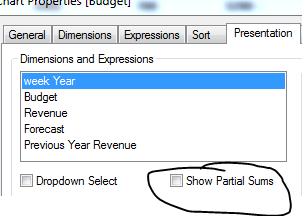
You can use Pivot table which allows for Partial sums. And to use a different expressions for those rows you can use the concept of dimensionality() which will get you to what you are trying to do.
To find Partial Sum look at the below image:
HTH
Best,
Sunny
- Mark as New
- Bookmark
- Subscribe
- Mute
- Subscribe to RSS Feed
- Permalink
- Report Inappropriate Content
Yes, you can enable Partial Sums for the dimensions use the dimensionality() function to check the dimension levels of the rows and use that to pick the expression:
pick(match(dimensionality())+1, sum(A), count(A), max(A))
talk is cheap, supply exceeds demand
- Mark as New
- Bookmark
- Subscribe
- Mute
- Subscribe to RSS Feed
- Permalink
- Report Inappropriate Content
Hi
On the presentation tab, set partial totals on Year and Quarter (and Month if you like). And then click "Subtotal on Top" option.
That will add the subtotal rows
HTH
Jonathan
- Mark as New
- Bookmark
- Subscribe
- Mute
- Subscribe to RSS Feed
- Permalink
- Report Inappropriate Content
Please find attached a sample application where you would see how to do it. I was not sure how you calculated the Total Rows so used Count for one and Avg for another one.
HTH
Best,
Sunny