Unlock a world of possibilities! Login now and discover the exclusive benefits awaiting you.
- Qlik Community
- :
- All Forums
- :
- QlikView App Dev
- :
- Re: How to scale all expressions into 1 to 10 scal...
- Subscribe to RSS Feed
- Mark Topic as New
- Mark Topic as Read
- Float this Topic for Current User
- Bookmark
- Subscribe
- Mute
- Printer Friendly Page
- Mark as New
- Bookmark
- Subscribe
- Mute
- Subscribe to RSS Feed
- Permalink
- Report Inappropriate Content
How to scale all expressions into 1 to 10 scale on Y - axis
Hi All ,
I have this bit different requirement from my client :
I am calculating monthwise Sales , Qty , Avg bill Value , Avg product per bill and showing it as a line chart separately .
Now client's requirement is to see all in one chart and that to on scale of 1 to 10 .
In simple way minimum of all expressions (i.e. sales , Qty , Avg bill value, Avg products per bill) has to be considered 1 , while maximum of all expressions has to be considered 10 . Now all values of all expressions lies between 1 to 10 & then it needs to show case as a line chart .
Looking for help here ASAP .
Thanks
- « Previous Replies
-
- 1
- 2
- Next Replies »
Accepted Solutions
- Mark as New
- Bookmark
- Subscribe
- Mute
- Subscribe to RSS Feed
- Permalink
- Report Inappropriate Content
So from the example above you should just be able to switch Member with Month for the variable values....
Just use the first attachment I put together (only by Member) and switch the variable from Member to Month (and switch the dimension from Member to Month as well).
- Mark as New
- Bookmark
- Subscribe
- Mute
- Subscribe to RSS Feed
- Permalink
- Report Inappropriate Content
Hi Bhushan,
Is this requirement dynamic or is it static? For example - as the user makes selections the minimum and maximum value will change -- will it be re-scaled (from 1 to 10) based on selections or is the minimum and maximum value based on what is originally defined in the script (with all selections cleared).
Thanks,
Camile
- Mark as New
- Bookmark
- Subscribe
- Mute
- Subscribe to RSS Feed
- Permalink
- Report Inappropriate Content
Maybe expressions like this can do what you need
SUM(Sales) / Sum(TOTAL Sales) // This return a number between 0 and 1
ceil(10* SUM(Sales) / Sum(TOTAL Sales)) // This return a number between 1 and 10
- Mark as New
- Bookmark
- Subscribe
- Mute
- Subscribe to RSS Feed
- Permalink
- Report Inappropriate Content
I believe you need to use the Fixed scale for all expressions if you use stack Bar graph
- Mark as New
- Bookmark
- Subscribe
- Mute
- Subscribe to RSS Feed
- Permalink
- Report Inappropriate Content
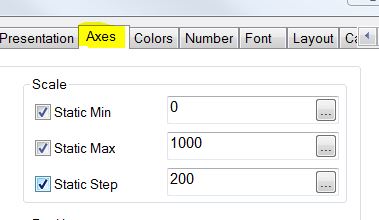
Please use the Object Properties on the Axes tab.
- Mark as New
- Bookmark
- Subscribe
- Mute
- Subscribe to RSS Feed
- Permalink
- Report Inappropriate Content

- Mark as New
- Bookmark
- Subscribe
- Mute
- Subscribe to RSS Feed
- Permalink
- Report Inappropriate Content
Hi Clever Anjos ,
Cheers !!  .. its very close to finish .
" ceil(10* SUM(Sales) / Sum(TOTAL Sales)) " looks working fine , but there is one problem in that .
I hv data of 3 years while monthly chart which i mentioned is for last 15 months only , so how sum( tOTAL sales) can be modified to dimension range defined ( here its 15 months) ??
ALso, how I can take this to for avg bill value which is sum(Sale) / sum ( bills) for particular month
- Mark as New
- Bookmark
- Subscribe
- Mute
- Subscribe to RSS Feed
- Permalink
- Report Inappropriate Content
Hi Bhushan,
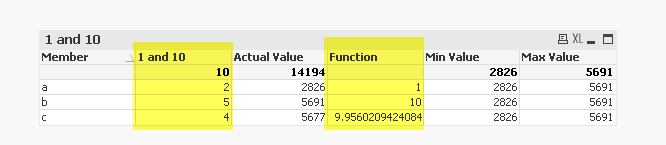
I've incorporated a few of the ideas mentioned above in an example. The first column highlighted below indicates the use of the ceiling function mentioned above.
I have also used a function below (second column highlighted) with the following function model:
f(x) = (b - a)(x - min) + a
max - min
In your example a = 1 and b = 10, but it could be substituted with any scale. I have listed the minimum sum by the dimension (which is stored in a variable called vMinValue). There is also a vMaxValue by the same dimension (in this case called Member). I'm not sure if this is your intent.
Please see attached for more details.
Thanks,
Camile
- Mark as New
- Bookmark
- Subscribe
- Mute
- Subscribe to RSS Feed
- Permalink
- Report Inappropriate Content
The above example uses the following concept:
and uses cleveranjos idea mentioned below:
Maybe expressions like this can do what you need
SUM(Sales) / Sum(TOTAL Sales) // This return a number between 0 and 1
ceil(10* SUM(Sales) / Sum(TOTAL Sales)) // This return a number between 1 and 10
For the function you would need to modify your min and max variables accordingly.
- Mark as New
- Bookmark
- Subscribe
- Mute
- Subscribe to RSS Feed
- Permalink
- Report Inappropriate Content
Is it based on the min/max value for the month or the min/max value over the entire period? See attached (and explanation below) for min of the month (over entire time frame selected). All you would have to do in that case is change the variable value to incorporate Month as part of the aggr function. To make the min/max value be within each month/dynamic you would need something a little different.
- « Previous Replies
-
- 1
- 2
- Next Replies »