Unlock a world of possibilities! Login now and discover the exclusive benefits awaiting you.
- Qlik Community
- :
- All Forums
- :
- QlikView App Dev
- :
- Re: In a chart, cumulative sum not persisting for ...
- Subscribe to RSS Feed
- Mark Topic as New
- Mark Topic as Read
- Float this Topic for Current User
- Bookmark
- Subscribe
- Mute
- Printer Friendly Page
- Mark as New
- Bookmark
- Subscribe
- Mute
- Subscribe to RSS Feed
- Permalink
- Report Inappropriate Content
In a chart, cumulative sum not persisting for a selected date range
I need some help in calculating the cumulative sum which persists the value of the whole date range and display the same value for a selected range as well.
Business case
We need to measure “ongoing subscriptions” count which is sum of previous day's ongoing subscriptions and current date subscriptions.
For day#1 Ongoing subscription is same as Subscription count.
Attached: payvia_Qlikview_Support_MockUp.qvw
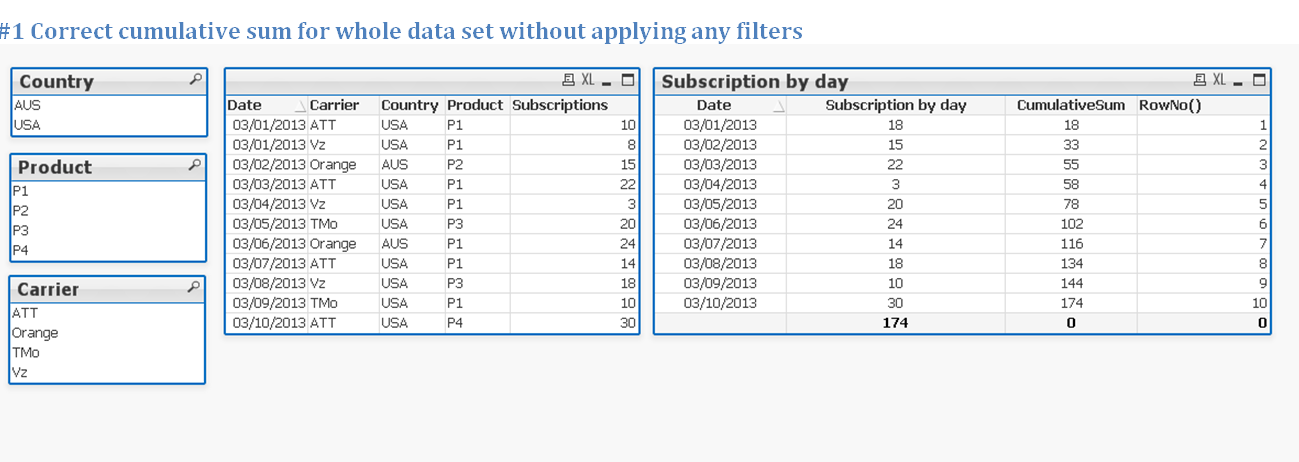
Screenshot#1 Cumulative sum for the whole date range
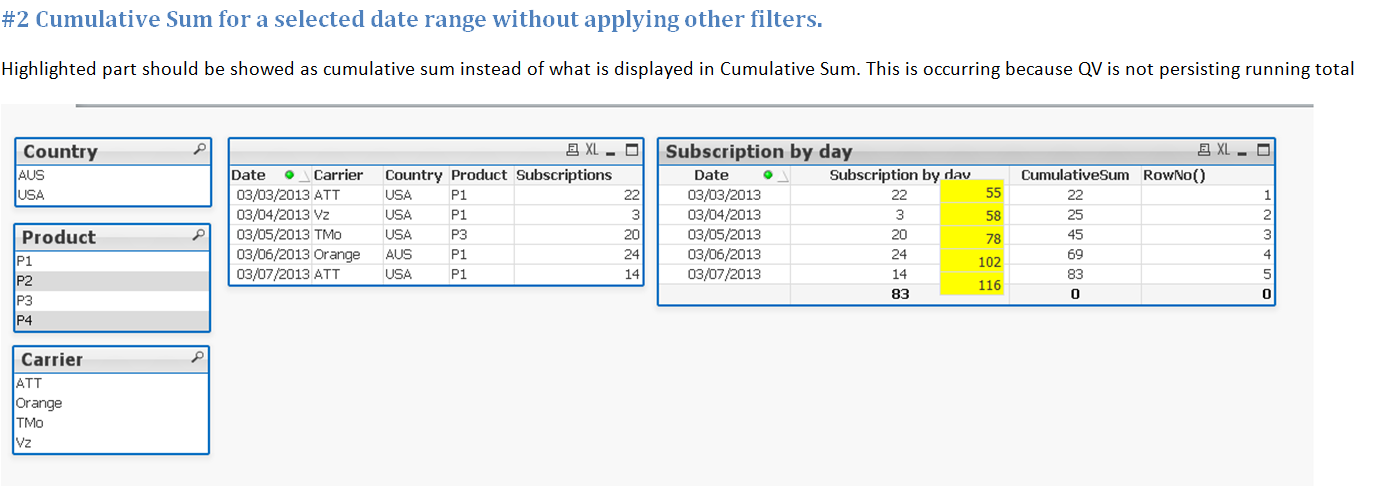
Screenshot#2 Cumulative sum for the selected date range. Desired value is in highlighted color below which is calculated separately and added to the screenshot
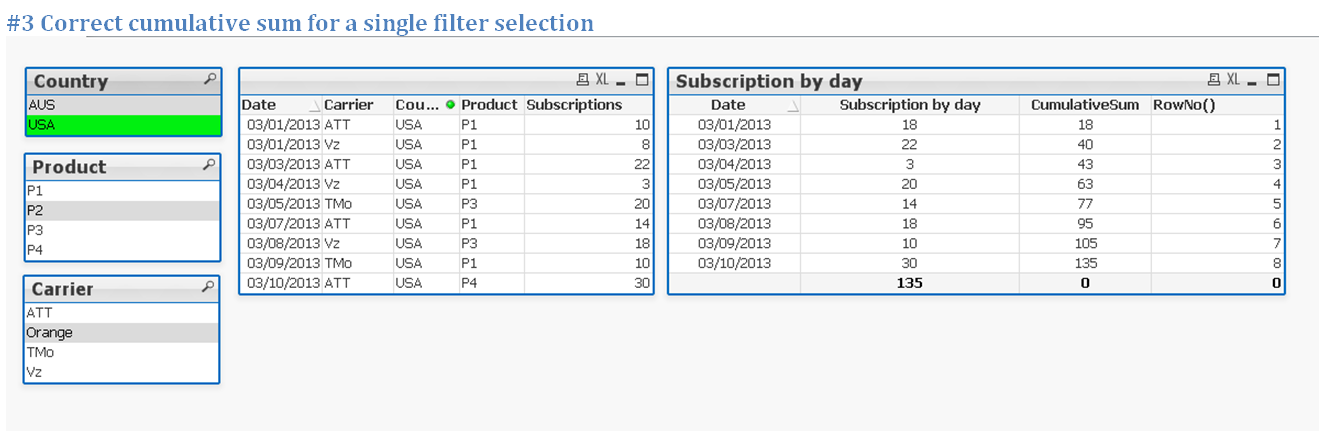
Screenshot#3: Cumulative sum for the entire date range for the selected filter
Screenshot#4: Cumulative sum of the selected date range and the filter. Desired result is highlighted and added in the below screenshot.

I would greatly appreciate if someone can help me with this problem?
FYI... I tried other approached like
- Calculate the cumulative total at SQL level and roll it to the QVW but the issue is we never know what filters the user will be selecting. In the sample document I attached, I have only 3 filters but in my original copy, I have 7 different filters for the user to select
- A single group by date would not work because, it will through off all the filters from the equation
Thanks and I appreciate any help.
- Mark as New
- Bookmark
- Subscribe
- Mute
- Subscribe to RSS Feed
- Permalink
- Report Inappropriate Content
Has anyone gave a shot at this?
- Mark as New
- Bookmark
- Subscribe
- Mute
- Subscribe to RSS Feed
- Permalink
- Report Inappropriate Content
Try an AsOf table. See here for an explanation of that concept and attached example.
talk is cheap, supply exceeds demand