Unlock a world of possibilities! Login now and discover the exclusive benefits awaiting you.
- Qlik Community
- :
- All Forums
- :
- QlikView App Dev
- :
- Line Values in a combo chart
- Subscribe to RSS Feed
- Mark Topic as New
- Mark Topic as Read
- Float this Topic for Current User
- Bookmark
- Subscribe
- Mute
- Printer Friendly Page
- Mark as New
- Bookmark
- Subscribe
- Mute
- Subscribe to RSS Feed
- Permalink
- Report Inappropriate Content
Line Values in a combo chart
Hi ,
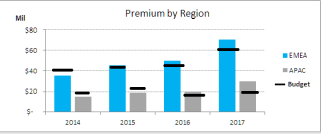
I have created below chart but unable to achieve the presentation of line i.e. Budget value.
Attached is the chart.
Chart1 : I have created
Chart2 : I want to achieve the presentation of budget line.
Please help if it is possible to achieve it.
- Mark as New
- Bookmark
- Subscribe
- Mute
- Subscribe to RSS Feed
- Permalink
- Report Inappropriate Content
Hi Nikita,
If you are using qliksense then goto chart properties
under measure section select budget measure and do changes as display in image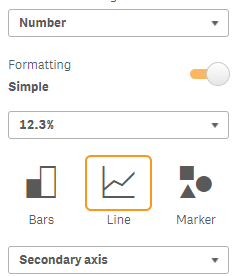
Thanks,
Arvind Patil
- Mark as New
- Bookmark
- Subscribe
- Mute
- Subscribe to RSS Feed
- Permalink
- Report Inappropriate Content
Hi Arvind,
I am using Qlikview.
Please let me know if you have any idea on it.
Thanks!!
- Mark as New
- Bookmark
- Subscribe
- Mute
- Subscribe to RSS Feed
- Permalink
- Report Inappropriate Content
have you checked like this ? in "Linestyle"
If(Budget >1,'<S2>','<S3>')
- Mark as New
- Bookmark
- Subscribe
- Mute
- Subscribe to RSS Feed
- Permalink
- Report Inappropriate Content
Hello - another option for the goal line is to have it as a symbol. on the Expressions tab under Display Options check Symbol and un-check line. There is a drop down next to the symbol box where you can select a square, triangle, plus sign. You can then use the Presentation tab to set the size of the symbol. Line/Symbol Settings lets you increase or decrease the size of the symbol.
Hope this helps.
Kathleen