Unlock a world of possibilities! Login now and discover the exclusive benefits awaiting you.
- Qlik Community
- :
- All Forums
- :
- QlikView App Dev
- :
- Re: Major & Minor Unit In Chart X-Axis
- Subscribe to RSS Feed
- Mark Topic as New
- Mark Topic as Read
- Float this Topic for Current User
- Bookmark
- Subscribe
- Mute
- Printer Friendly Page
- Mark as New
- Bookmark
- Subscribe
- Mute
- Subscribe to RSS Feed
- Permalink
- Report Inappropriate Content
Major & Minor Unit In Chart X-Axis
Hi,
I need help in formatting the X Axis of a chart. Here is the table on which I am creating the chart.
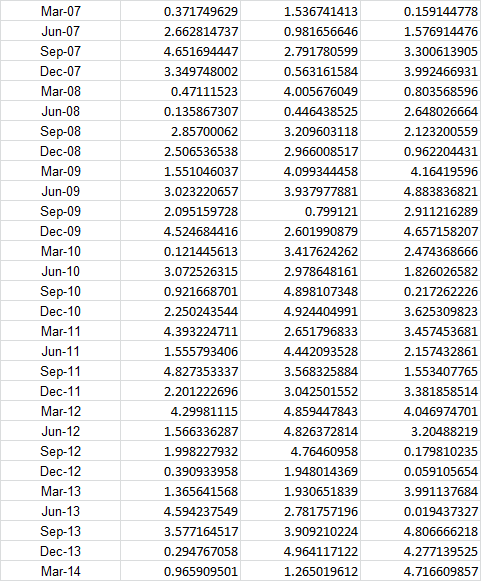
Here you can see every year has 4 entries, But in the below chart we are showing only one entry for each year.
Using the above table I have created a chart in excel.
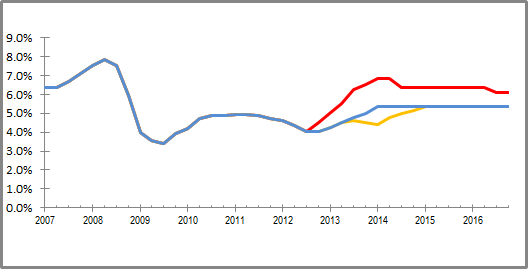
Here in the chart you can see I have used major and minor units to hide 3 entries of each year. Only march month for each year is displayed in the chart axis and the june, sep, dec is shown as the minor unit. Now I am trying to do the same in Qlikview which is I am not able to do.
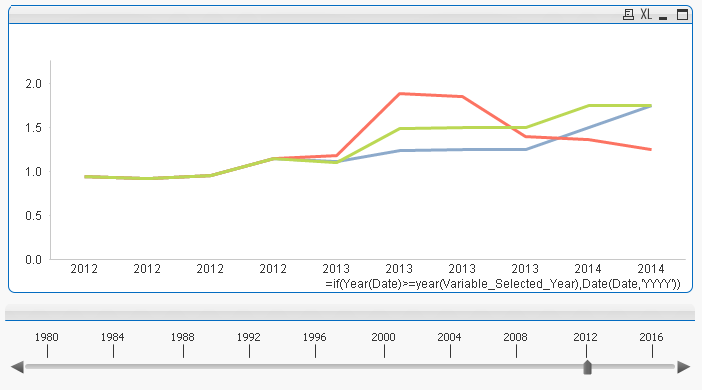
I am trying to use a scroller to scroll through the years, but as you can see 2012 is repeating 4 times. Is it possible to show only the starting of each year in major unit and rest in minor unit. Please help
- Mark as New
- Bookmark
- Subscribe
- Mute
- Subscribe to RSS Feed
- Permalink
- Report Inappropriate Content
Hi,
Check this file, hope it helps you.
Regards,
Jagan.
- Mark as New
- Bookmark
- Subscribe
- Mute
- Subscribe to RSS Feed
- Permalink
- Report Inappropriate Content
Thank you Jagan, but this is not solving the issue.
- Mark as New
- Bookmark
- Subscribe
- Mute
- Subscribe to RSS Feed
- Permalink
- Report Inappropriate Content
Hi,
Instead of using calculated dimension to arrive year, get year as dimension in Script. I think this solves the issue.
If not can you attach sample file.
Regards,
Jagan.
- Mark as New
- Bookmark
- Subscribe
- Mute
- Subscribe to RSS Feed
- Permalink
- Report Inappropriate Content
Attached is the sample file...
- Mark as New
- Bookmark
- Subscribe
- Mute
- Subscribe to RSS Feed
- Permalink
- Report Inappropriate Content
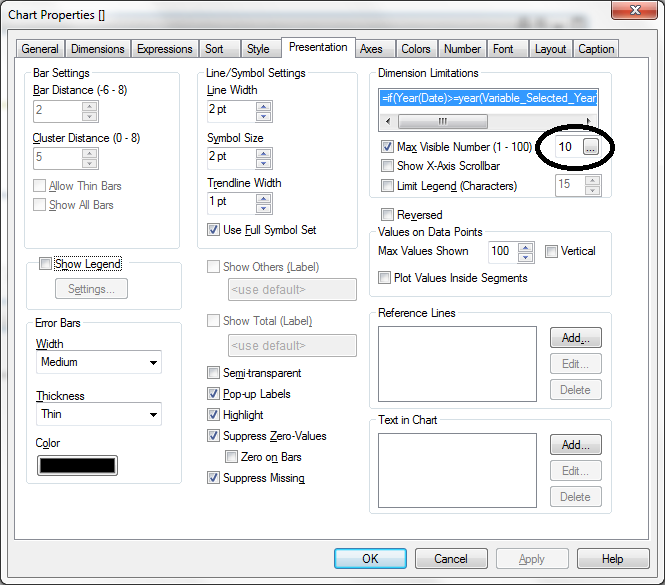
The MAX VISIBLE NO is set to 10 as I have to show 10 years records only