Unlock a world of possibilities! Login now and discover the exclusive benefits awaiting you.
- Qlik Community
- :
- All Forums
- :
- QlikView App Dev
- :
- Need help in aggr function
- Subscribe to RSS Feed
- Mark Topic as New
- Mark Topic as Read
- Float this Topic for Current User
- Bookmark
- Subscribe
- Mute
- Printer Friendly Page
- Mark as New
- Bookmark
- Subscribe
- Mute
- Subscribe to RSS Feed
- Permalink
- Report Inappropriate Content
Need help in aggr function
Hi All,
Actually i have a problem in straight table chart.
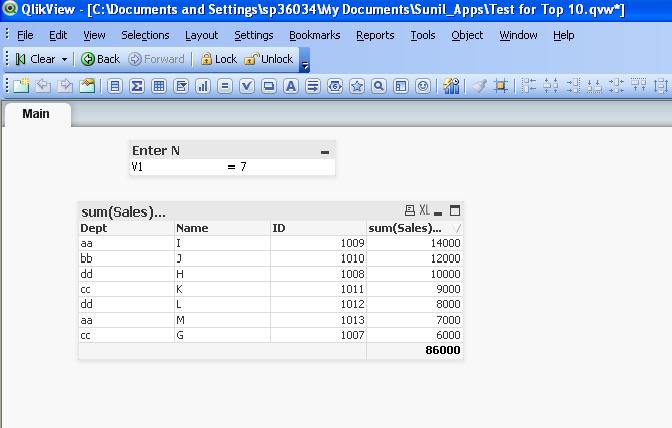
a>
In this app when i enter the variable as 7 , it is showing the top 6 sum(sales), but in the total row it is showing the total of all the rows (86000) instead of 66000.
I have attched the application, as it is having inline data all can reload this app.
b>
I have also a second requirement i need the % Contribution of Top N "Sum(Sales)" against the Sum(Total sales).
I have tried the Set expression but it is not working
sum({$<Dept={"aggr(if(rank(sum(Sales))<=$(V1),Dept),Name,Dept,ID)"}>}Sales) / Sum(TOTAL Sales)
here i need the %Contribution of Sum(Sales) of Top V1 Dept against Sum(Total Sales)
Please help me solving this and let me know if any queries regarding understanding the requirement.
PFA application.
Regards
Sunil
- « Previous Replies
-
- 1
- 2
- Next Replies »
Accepted Solutions
- Mark as New
- Bookmark
- Subscribe
- Mute
- Subscribe to RSS Feed
- Permalink
- Report Inappropriate Content
Hi Celam and Perumal,
Thanks for your response. The expression given by Celam is working correctly. How much i can able to do it in my complicated case has to be watched.
Sum(aggr(if(Rank(Total Sum(Sales))<=V1,Sum(Sales)),Name,ID,Dept))
Thanks
Sunil.
- Mark as New
- Bookmark
- Subscribe
- Mute
- Subscribe to RSS Feed
- Permalink
- Report Inappropriate Content
Hi Sunil,
I attache d one file .please check is correct or not .
i thing useful for u.
Regards
Perumal A
- Mark as New
- Bookmark
- Subscribe
- Mute
- Subscribe to RSS Feed
- Permalink
- Report Inappropriate Content
Hi Perumal,
Great Work this what it should be
nice work !!!!!
Warm Regards
Anant
- Mark as New
- Bookmark
- Subscribe
- Mute
- Subscribe to RSS Feed
- Permalink
- Report Inappropriate Content
Hi Perumal,
"Sum(Aggr(if(rank(sum(Sales))<=V1,sum(Sales)),ID))"
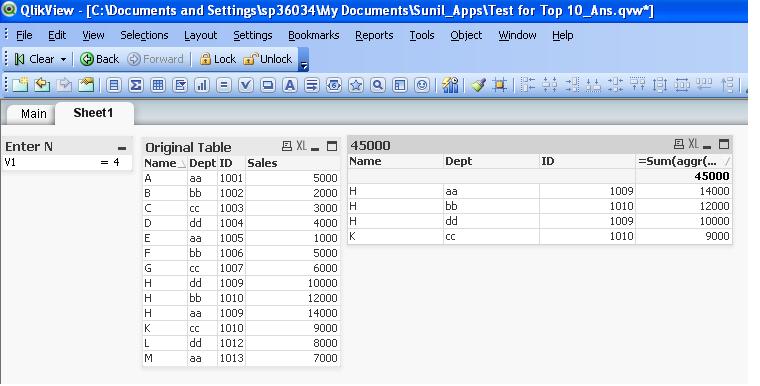
Thanks for your reply. Actually here we have a field which is Unique and not null (i.e. ID). But in real scenario what i am facing is : ID is not unique. Rather the combination of all the fields make a row unique.
The Data is like:
LOAD * INLINE [
Name, Dept, ID, Sales
A, aa, 1001, 5000
B, bb, 1002, 2000
C, cc, 1003, 3000
D, dd, 1004, 4000
E, aa, 1005, 1000
F, bb, 1006, 5000
G, cc, 1007, 6000
H, dd, 1009, 10000
I, aa, 1009, 14000
J, bb, 1010, 12000
K, cc, 1010, 9000
L, dd, 1012, 8000
M, aa, 1013, 7000
];
i hope u will be able to understand my problem.
Regards
Sunil
- Mark as New
- Bookmark
- Subscribe
- Mute
- Subscribe to RSS Feed
- Permalink
- Report Inappropriate Content
Hi Perumal,
"Sum(Aggr(if(rank(sum(Sales))<=V1,sum(Sales)),ID))"
Thanks for your reply. Actually here we have a field which is Unique and not null (i.e. ID). But in real scenario what i am facing is : ID is not unique. Rather the combination of all the fields make a row unique.
The Data is like:
LOAD * INLINE [
Name, Dept, ID, Sales
A, aa, 1001, 5000
B, bb, 1002, 2000
C, cc, 1003, 3000
D, dd, 1004, 4000
E, aa, 1005, 1000
F, bb, 1006, 5000
G, cc, 1007, 6000
H, dd, 1009, 10000
I, aa, 1009, 14000
J, bb, 1010, 12000
K, cc, 1010, 9000
L, dd, 1012, 8000
M, aa, 1013, 7000
];
i hope u will be able to understand my problem.
Regards
Sunil
- Mark as New
- Bookmark
- Subscribe
- Mute
- Subscribe to RSS Feed
- Permalink
- Report Inappropriate Content
hi Sunil
try this expression
Sum(Aggr(if(rank(sum(Sales))<=V1,sum(Sales)),ID&Name&Dept))
Regards
Perumal
- Mark as New
- Bookmark
- Subscribe
- Mute
- Subscribe to RSS Feed
- Permalink
- Report Inappropriate Content
Hi,
Use this expression if there are no Unique ID fields
Sum(Aggr(if(rank(sum(Sales))<=V1,sum(Sales)),ID, Name))
Regards,
Jagan.
- Mark as New
- Bookmark
- Subscribe
- Mute
- Subscribe to RSS Feed
- Permalink
- Report Inappropriate Content
Hi Perumal,
While i use this expression
Sum(Aggr(if(rank(sum(Sales))<=V1,sum(Sales)),ID&Name&Dept))
It shows wrong value.

Here though H,bb,1010 having sum(Sales) as 12000 but in the chart it is showing L,dd,1012 having sum(sales) 12000 , which is wrong information.
Qlikview file Attached .
Still i am not able to get the correct value.
Regards
- Mark as New
- Bookmark
- Subscribe
- Mute
- Subscribe to RSS Feed
- Permalink
- Report Inappropriate Content
Hi,
Try with this expression
=Sum({<ID={"=Rank(Sum(Sales))<$(V1)"}>}Sales)
Celambarasan
- Mark as New
- Bookmark
- Subscribe
- Mute
- Subscribe to RSS Feed
- Permalink
- Report Inappropriate Content
Hi,
Change you table structure like this with unique field
Load Name&Dept&ID as Key,*;
LOAD * INLINE [
Name, Dept, ID, Sales
A, aa, 1001, 5000
B, bb, 1002, 2000
C, cc, 1003, 3000
D, dd, 1004, 4000
E, aa, 1005, 1000
F, bb, 1006, 5000
G, cc, 1007, 6000
H, dd, 1009, 10000
I, aa, 1009, 14000
J, bb, 1010, 12000
K, cc, 1010, 9000
L, dd, 1012, 8000
M, aa, 1013, 7000
];
Use following one as expression
=Sum({<Key={"=Rank(Sum(Sales))<=$(V1)"}>} Sales)
- « Previous Replies
-
- 1
- 2
- Next Replies »