Unlock a world of possibilities! Login now and discover the exclusive benefits awaiting you.
- Qlik Community
- :
- All Forums
- :
- QlikView App Dev
- :
- Re: Overlap expressions in bar chart
- Subscribe to RSS Feed
- Mark Topic as New
- Mark Topic as Read
- Float this Topic for Current User
- Bookmark
- Subscribe
- Mute
- Printer Friendly Page
- Mark as New
- Bookmark
- Subscribe
- Mute
- Subscribe to RSS Feed
- Permalink
- Report Inappropriate Content
Overlap expressions in bar chart
Hello everybody,
I have the following 2 expressions, summing quantities for this year and last year:
Expression 1 (AC): Sum( {<Year = {($(=vYear)}, Month =>}
Expression 2 (AP) : Sum( {<Year = {($(=vYear-1)}>}
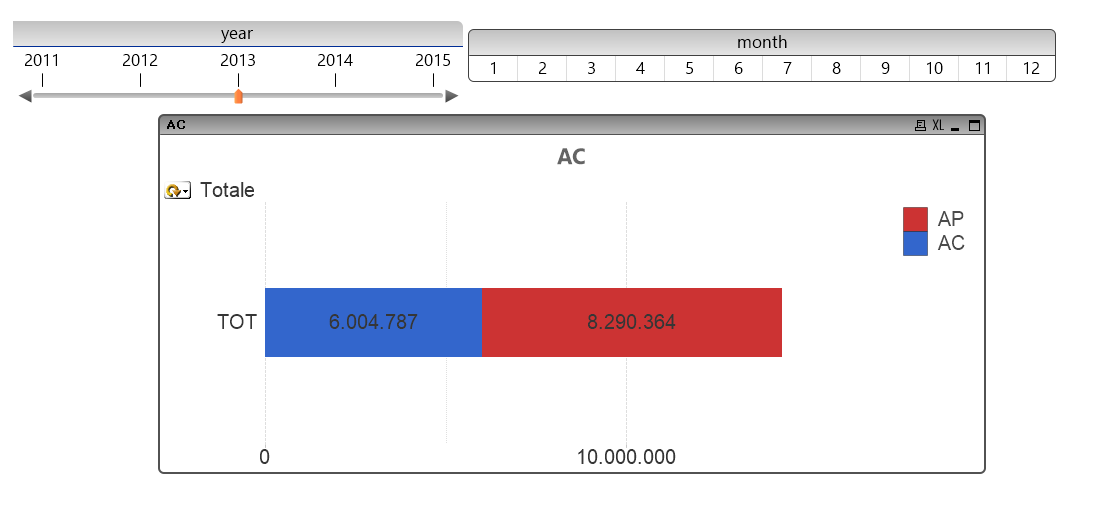
What I want to create is a bar chart where the 2 expression overlap, like in an actual vs budget scenario: AP is like the budget while AC is the actual.
As you can see from the picture, the problem is that, using stacked bar chart, the total length of the bar is the sum of the 2 expressions (6.004.787+8.290.364) because AP starts from the end of AC, whereas I want AP to start from 0 so that the total length is not the sum of the 2 expression.
Anyone knows a possible solution?
Thanks in advance
Francesco
Accepted Solutions
- Mark as New
- Bookmark
- Subscribe
- Mute
- Subscribe to RSS Feed
- Permalink
- Report Inappropriate Content
Use as second expression Sum( {<Year = {($(=vYear-1)}>} ...) - Sum( {<Year = {($(=vYear)}, Month =>} ...)
talk is cheap, supply exceeds demand
- Mark as New
- Bookmark
- Subscribe
- Mute
- Subscribe to RSS Feed
- Permalink
- Report Inappropriate Content
Use as second expression Sum( {<Year = {($(=vYear-1)}>} ...) - Sum( {<Year = {($(=vYear)}, Month =>} ...)
talk is cheap, supply exceeds demand
- Mark as New
- Bookmark
- Subscribe
- Mute
- Subscribe to RSS Feed
- Permalink
- Report Inappropriate Content
Hi Francesco,
Use dual function.
Dual(ValueToShow with Format, ValueOfData).
First parameter is the value to show in graph, and second parameter is the lenght of your bar.
Regards!
- Mark as New
- Bookmark
- Subscribe
- Mute
- Subscribe to RSS Feed
- Permalink
- Report Inappropriate Content
Hi Francesco,
Adding to Gysbert & Manuel, I would use the Dual function too but as AP could be either greater than or less than AC, you would need to do something like this:
AC
if(Sum( {<Year = {($(=vYear)}, Month =>} YourValue) < Sum( {<Year = {($(=vYear-1)}, Month =>} YourValue),
Dual(
Sum( {<Year = {($(=vYear)}, Month =>} YourValue), //data to display in bar
Sum( {<Year = {($(=vYear)}, Month =>} YourValue) //length of bar
),
if(Sum( {<Year = {($(=vYear)}, Month =>} YourValue) >= Sum( {<Year = {($(=vYear-1)}, Month =>} YourValue),
Dual(
Sum( {<Year = {($(=vYear)}, Month =>} YourValue), //data to display in bar
Sum( {<Year = {($(=vYear-1)}, Month =>} YourValue) - Sum( {<Year = {($(=vYear)}, Month =>} YourValue) //length of bar
)
))
AP
if(Sum( {<Year = {($(=vYear-1)}, Month =>} YourValue) < Sum( {<Year = {($(=vYear)}, Month =>} YourValue),
Dual(
Sum( {<Year = {($(=vYear-1)}, Month =>} YourValue), //data to display in bar
Sum( {<Year = {($(=vYear)}, Month =>} YourValue)-Sum( {<Year = {($(=vYear-1)}, Month =>} YourValue) //length of bar
),
if(Sum( {<Year = {($(=vYear-1)}, Month =>} YourValue) >= Sum( {<Year = {($(=vYear)}, Month =>} YourValue),
Dual(
Sum( {<Year = {($(=vYear-1)}, Month =>} YourValue), //data to display in bar
Sum( {<Year = {($(=vYear-1)}, Month =>} YourValue) - Sum( {<Year = {($(=vYear)}, Month =>} YourValue) //length of bar
)
))
Then you should colour code the background of AP to some thing like:
if(Sum( {<Year = {($(=vYear)}, Month =>} YourValue) < Sum( {<Year = {($(=vYear-1)}, Month =>} YourValue),
LightRed(),
LightGreen()
)
This all should keep the total size of the bar at the largest amount (either AC or AP) and AP will be Red if it is greater than last year and Green if it is lower.
- Mark as New
- Bookmark
- Subscribe
- Mute
- Subscribe to RSS Feed
- Permalink
- Report Inappropriate Content
Hi Francesco,
See this example:
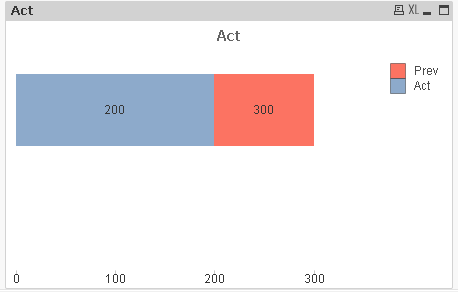
Act = Sum( {<Year = {($(=vYear)}, Month =>} YourFieldValue)
Prev = Dual(Num(Sum( {<Year = {'$(=vYear-1)'}>} YourFieldValue),'#,##0'), Sum( {<Year = {'$(=vYear-1)'}>} YourFieldValue)-Sum( {<Year = {($(=vYear)}, Month =}>} YourFieldValue))
Regards!!
- Mark as New
- Bookmark
- Subscribe
- Mute
- Subscribe to RSS Feed
- Permalink
- Report Inappropriate Content
Thanks Gysbert, that is the correct answer. I just had to remember to check "Still Show Total on Top" in the presentation tab to show the total number outside the bar.
- Mark as New
- Bookmark
- Subscribe
- Mute
- Subscribe to RSS Feed
- Permalink
- Report Inappropriate Content
Thanks Ciaran, that could be useful!
- Mark as New
- Bookmark
- Subscribe
- Mute
- Subscribe to RSS Feed
- Permalink
- Report Inappropriate Content
Thanks Manuel, in this case it worked also without the dual function.
- Mark as New
- Bookmark
- Subscribe
- Mute
- Subscribe to RSS Feed
- Permalink
- Report Inappropriate Content
Hi Francesco.
But you will not see the real value on second expression, with dual you can see the value and get the length that you want.
Regards!