Unlock a world of possibilities! Login now and discover the exclusive benefits awaiting you.
- Qlik Community
- :
- All Forums
- :
- QlikView App Dev
- :
- Re: Pivot Table Total
- Subscribe to RSS Feed
- Mark Topic as New
- Mark Topic as Read
- Float this Topic for Current User
- Bookmark
- Subscribe
- Mute
- Printer Friendly Page
- Mark as New
- Bookmark
- Subscribe
- Mute
- Subscribe to RSS Feed
- Permalink
- Report Inappropriate Content
Pivot Table Total
Hello,
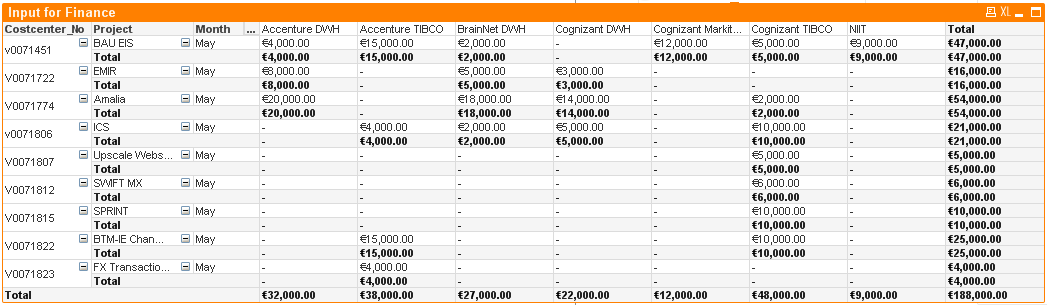
I made a pivot table for invoicing monthly costs. Attached is the screenshot for May. As you can see, cost centers, projects, and the month are displayed as columns, whereas each team is presented on the top horizontally (required by the management). I would like to add a total for each project and each team at the end of each row/column, but I couldn't get it right. The option "Total mode" in the expression tab is grey, which means I can only crack this from the expression itself, I suppose.
My current expression is simply sum(Allocation_Amount), and the field names for project and team are Project_Name and Party_Name, respectively. Please help me with it. Thank you very much in advance.
Regards,
Tuan
Accepted Solutions
- Mark as New
- Bookmark
- Subscribe
- Mute
- Subscribe to RSS Feed
- Permalink
- Report Inappropriate Content
Then click show partial sum for costcenter number only.
Uncheck for others.
Regards
ASHFAQ
- Mark as New
- Bookmark
- Subscribe
- Mute
- Subscribe to RSS Feed
- Permalink
- Report Inappropriate Content
Go to presentation tab
Select your Dimensions
Tick Show Partial Sums
- Mark as New
- Bookmark
- Subscribe
- Mute
- Subscribe to RSS Feed
- Permalink
- Report Inappropriate Content
H,
Go to chart properties --> Presentation tab --> Select your dimension --> and now select show partial sum.
Regards
ASHFAQ
- Mark as New
- Bookmark
- Subscribe
- Mute
- Subscribe to RSS Feed
- Permalink
- Report Inappropriate Content
Hi Manish,
Thanks for the suggestion. It's ALMOST what I wanted to achieve, except that it shows a total at every level...Is there a way to only show a grand total? (i.e. only the last row and column as shown in the attachment below.) Thanks!
- Mark as New
- Bookmark
- Subscribe
- Mute
- Subscribe to RSS Feed
- Permalink
- Report Inappropriate Content
Hi Ashfaq,
Thanks! But is there a way to show only grand total? Please see my reply to Manish above to see the current result. Thanks!
- Mark as New
- Bookmark
- Subscribe
- Mute
- Subscribe to RSS Feed
- Permalink
- Report Inappropriate Content
Then click show partial sum for costcenter number only.
Uncheck for others.
Regards
ASHFAQ
- Mark as New
- Bookmark
- Subscribe
- Mute
- Subscribe to RSS Feed
- Permalink
- Report Inappropriate Content
Thanks a lot! Works perfect now!
- Mark as New
- Bookmark
- Subscribe
- Mute
- Subscribe to RSS Feed
- Permalink
- Report Inappropriate Content
Welcome 
Regards
ASHFAQ