Unlock a world of possibilities! Login now and discover the exclusive benefits awaiting you.
- Qlik Community
- :
- All Forums
- :
- QlikView App Dev
- :
- Plot Numbers on Segments does not display any numb...
- Subscribe to RSS Feed
- Mark Topic as New
- Mark Topic as Read
- Float this Topic for Current User
- Bookmark
- Subscribe
- Mute
- Printer Friendly Page
- Mark as New
- Bookmark
- Subscribe
- Mute
- Subscribe to RSS Feed
- Permalink
- Report Inappropriate Content
Plot Numbers on Segments does not display any numbers
Hi all,
I'm trying to create a bar chart on our AccessPoint and to display the expression value inside the bar. There is an option called Plot Numbers on Segments. But it seems to have no effect. I've widened the chart so that there would be plenty of room to display the number, but that has no effect either.
We're using QlikView Server 11.20.13507.0 with Ajax.
Any help is appreciated!
Accepted Solutions
- Mark as New
- Bookmark
- Subscribe
- Mute
- Subscribe to RSS Feed
- Permalink
- Report Inappropriate Content
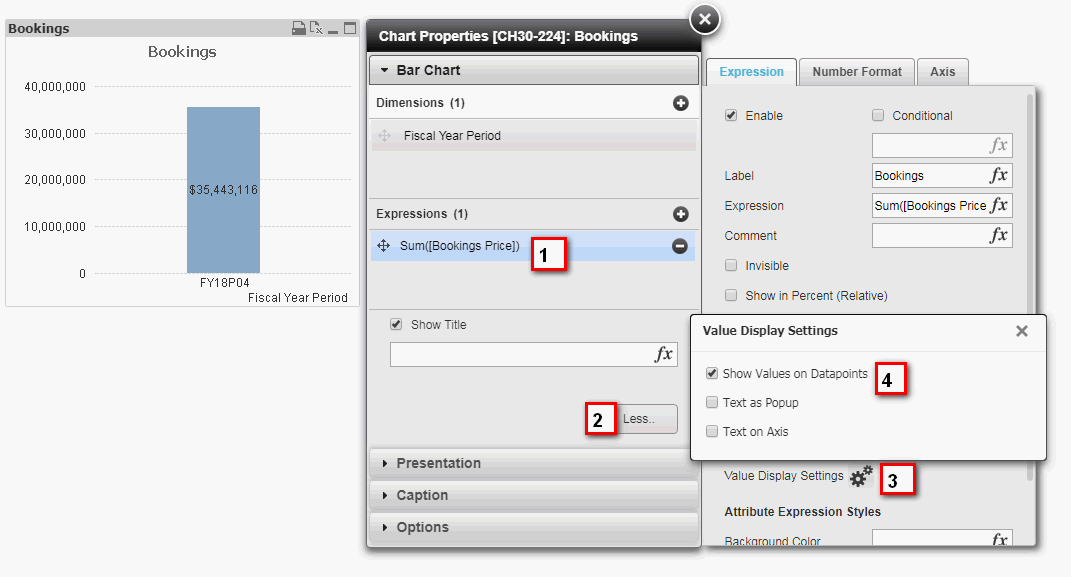
You also have to go to your expression, click "More", click "Value Display Settings", then check "Show Values on Datapoints".
- Mark as New
- Bookmark
- Subscribe
- Mute
- Subscribe to RSS Feed
- Permalink
- Report Inappropriate Content
You also have to go to your expression, click "More", click "Value Display Settings", then check "Show Values on Datapoints".
- Mark as New
- Bookmark
- Subscribe
- Mute
- Subscribe to RSS Feed
- Permalink
- Report Inappropriate Content
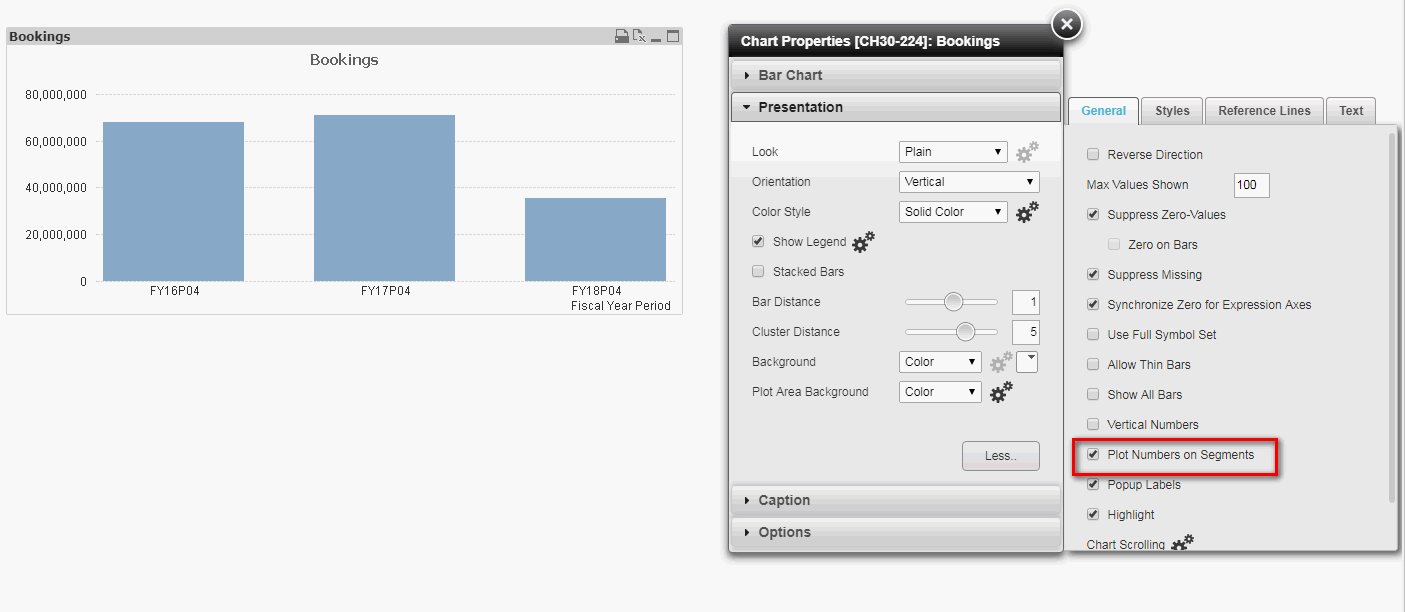
Great, thank you! For those who would like a picture: