Unlock a world of possibilities! Login now and discover the exclusive benefits awaiting you.
- Qlik Community
- :
- All Forums
- :
- QlikView App Dev
- :
- Re: Show/hide Value Data Points in the chart based...
- Subscribe to RSS Feed
- Mark Topic as New
- Mark Topic as Read
- Float this Topic for Current User
- Bookmark
- Subscribe
- Mute
- Printer Friendly Page
- Mark as New
- Bookmark
- Subscribe
- Mute
- Subscribe to RSS Feed
- Permalink
- Report Inappropriate Content
Show/hide Value Data Points in the chart based on a button
Goal:
Show/hide Value Data Points in the chart based on a button
Problem:
I don't know how to do it so I gonna need som help.
Accepted Solutions
- Mark as New
- Bookmark
- Subscribe
- Mute
- Subscribe to RSS Feed
- Permalink
- Report Inappropriate Content
Hi Akirajit
Actually if you expand the expression list there is an option to enter an expression under the heading "Show Value".
Start by expanding the expression you are working with (as per screen shot) and click on the box marked "show value"
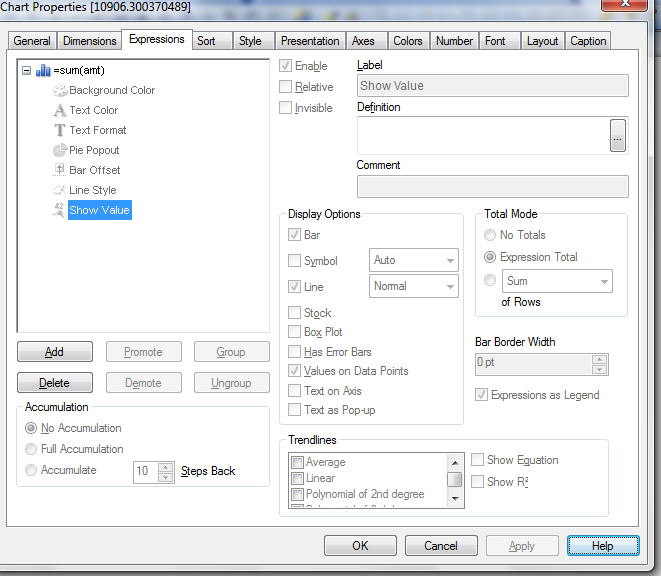
In the definition, enter an expression that evaluates to 1 to show the values and 0 to remove them. This can be a reference to a variable that is set by clicking a button.
One warning though: you need "values on data points" unchecked. If it becomes checked it overrides the expression.
Regards,
Erica
- Mark as New
- Bookmark
- Subscribe
- Mute
- Subscribe to RSS Feed
- Permalink
- Report Inappropriate Content
You can have two charts: one that shows the values on data points and another that does not. Overlay them, and use a variable in the Show/Hide condition (on the layout tab) for each chart. Have the button set the variable to the appropriate value for which chart should show. I'm not sure if there is a way to check or uncheck the box by using a macro, but I'm thinking there isn't...
- Mark as New
- Bookmark
- Subscribe
- Mute
- Subscribe to RSS Feed
- Permalink
- Report Inappropriate Content
Hi Akirajit
Actually if you expand the expression list there is an option to enter an expression under the heading "Show Value".
Start by expanding the expression you are working with (as per screen shot) and click on the box marked "show value"
In the definition, enter an expression that evaluates to 1 to show the values and 0 to remove them. This can be a reference to a variable that is set by clicking a button.
One warning though: you need "values on data points" unchecked. If it becomes checked it overrides the expression.
Regards,
Erica
- Mark as New
- Bookmark
- Subscribe
- Mute
- Subscribe to RSS Feed
- Permalink
- Report Inappropriate Content
if i use show value option..
the format of the expression is changed
- Mark as New
- Bookmark
- Subscribe
- Mute
- Subscribe to RSS Feed
- Permalink
- Report Inappropriate Content
What happens to the format Raja?