Unlock a world of possibilities! Login now and discover the exclusive benefits awaiting you.
- Qlik Community
- :
- All Forums
- :
- QlikView App Dev
- :
- Re: Stacked bar with each stack for one value in a...
- Subscribe to RSS Feed
- Mark Topic as New
- Mark Topic as Read
- Float this Topic for Current User
- Bookmark
- Subscribe
- Mute
- Printer Friendly Page
- Mark as New
- Bookmark
- Subscribe
- Mute
- Subscribe to RSS Feed
- Permalink
- Report Inappropriate Content
Stacked bar with each stack for one value in a field
Hi All,
A new question again 
Not sure if this is possible in QlikView. So just wanted a suggestion on how best can this be implemented.
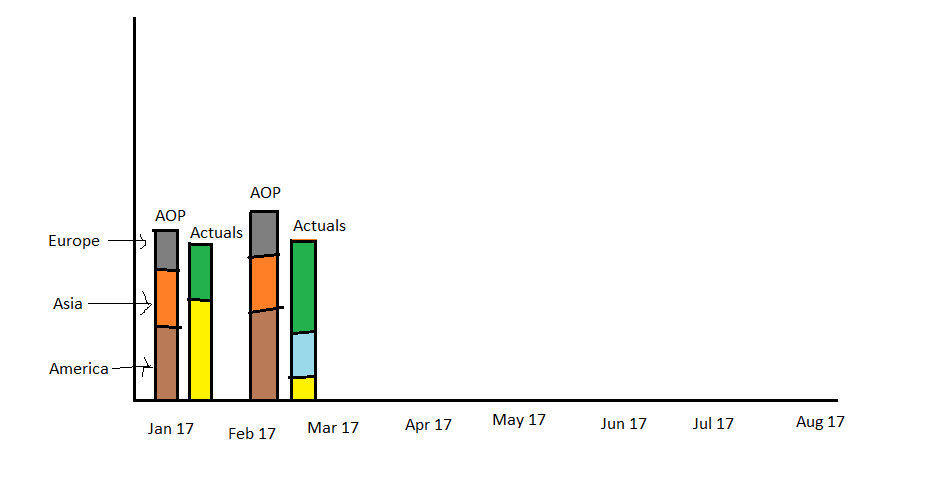
A stacked bar graph has to be created which displays data of AOP and Actuals based on Month, Year and weeks (cyclic group). The way stacked bar should be implemented is as shown in the attached picture. Bars should be stacked based on region (one stack per region in a single expression bar) for AOP and Actuals. Is this possible in QlikView?
Thank you.
Message was edited by: Apoorva SD Any suggestion?
Accepted Solutions
- Mark as New
- Bookmark
- Subscribe
- Mute
- Subscribe to RSS Feed
- Permalink
- Report Inappropriate Content
Please try with this
- Mark as New
- Bookmark
- Subscribe
- Mute
- Subscribe to RSS Feed
- Permalink
- Report Inappropriate Content
Please try with this
- Mark as New
- Bookmark
- Subscribe
- Mute
- Subscribe to RSS Feed
- Permalink
- Report Inappropriate Content
Hello,
Thank you very much 
I was looking for something like this. That helped me.