Unlock a world of possibilities! Login now and discover the exclusive benefits awaiting you.
- Qlik Community
- :
- All Forums
- :
- QlikView App Dev
- :
- Variance in a Chart - Excel example included
- Subscribe to RSS Feed
- Mark Topic as New
- Mark Topic as Read
- Float this Topic for Current User
- Bookmark
- Subscribe
- Mute
- Printer Friendly Page
- Mark as New
- Bookmark
- Subscribe
- Mute
- Subscribe to RSS Feed
- Permalink
- Report Inappropriate Content
Variance in a Chart - Excel example included
I want to create a chart with one dimension (material) and 4 formulas. I have difficulties with the variance.
There is a "quota", "cost of sales" and "avg price" which are no trouble, but there is a range (min price, max price) and I want to display this range within the chart.
Enclosed is a exapmle from Excel.
Is it possible to create a chart like the excel chart within QlikView?
Thanks a lot in advanced.
Accepted Solutions
- Mark as New
- Bookmark
- Subscribe
- Mute
- Subscribe to RSS Feed
- Permalink
- Report Inappropriate Content
Hi,
Have a look at this example.
Regards,
Kaushik Solanki
- Mark as New
- Bookmark
- Subscribe
- Mute
- Subscribe to RSS Feed
- Permalink
- Report Inappropriate Content
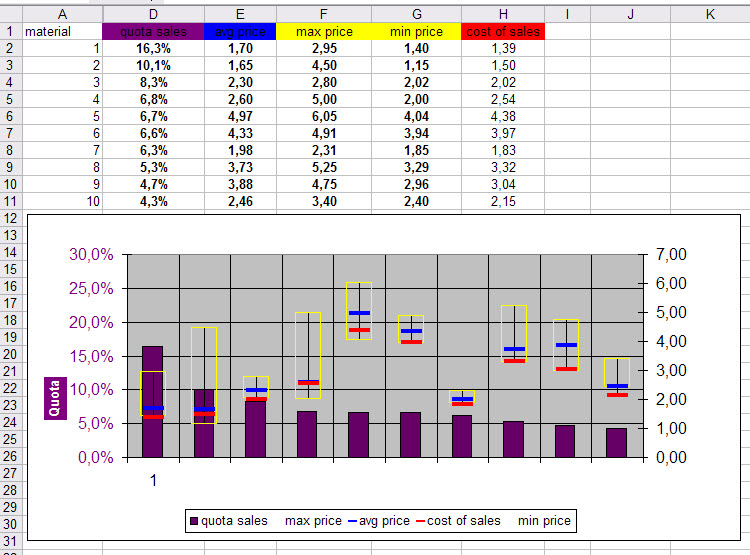
Thats the chart I want to see in QV, the problem ist the yellow chart (max -min price)
- Mark as New
- Bookmark
- Subscribe
- Mute
- Subscribe to RSS Feed
- Permalink
- Report Inappropriate Content
Hi:
It is going to be difficult. Those yellow boxes look to me as Box & Mustache boxes. The yellow box tells you the area that includes 95 % of the population. Red and Blue beams are specific values in the sample.
You may want to use grouped bars in your graphic to simulate that effect.
- Mark as New
- Bookmark
- Subscribe
- Mute
- Subscribe to RSS Feed
- Permalink
- Report Inappropriate Content
Hi,
Have a look at this example.
Regards,
Kaushik Solanki
- Mark as New
- Bookmark
- Subscribe
- Mute
- Subscribe to RSS Feed
- Permalink
- Report Inappropriate Content
Thanks a lot to both. Kaushik.solanki, this example is perfekt. 