Unlock a world of possibilities! Login now and discover the exclusive benefits awaiting you.
- Qlik Community
- :
- All Forums
- :
- QlikView App Dev
- :
- Re: filter affects background color of expression
- Subscribe to RSS Feed
- Mark Topic as New
- Mark Topic as Read
- Float this Topic for Current User
- Bookmark
- Subscribe
- Mute
- Printer Friendly Page
- Mark as New
- Bookmark
- Subscribe
- Mute
- Subscribe to RSS Feed
- Permalink
- Report Inappropriate Content
filter affects background color of expression
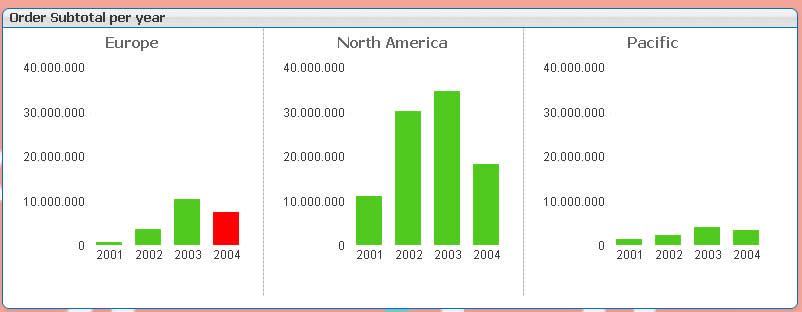
I created a Trellis barchart with 2 dimensions (territory and orderyear) and 1 expression (sum of OrderSubTotal)
In order to avoid that document filters effect the chart, the {1} set identifier is used in the expression =Sum ({1}OrderSubTotal)
To emphasize the last year, the background color of the expression was changed to =if(OrderYear=$(LastYear),lightred(),color(1))
If you filter the data, e.g. territory='Europe', the values of the chart don't change, but the background color is also filtered (see screenshot)
How to overcome this problem?
Accepted Solutions
- Mark as New
- Bookmark
- Subscribe
- Mute
- Subscribe to RSS Feed
- Permalink
- Report Inappropriate Content
Try this instead to ingore the selections for the background color expression too:
=if(only({1}OrderYear)=$(LastYear),lightred(),color(1))
talk is cheap, supply exceeds demand
- Mark as New
- Bookmark
- Subscribe
- Mute
- Subscribe to RSS Feed
- Permalink
- Report Inappropriate Content
Try this instead to ingore the selections for the background color expression too:
=if(only({1}OrderYear)=$(LastYear),lightred(),color(1))
talk is cheap, supply exceeds demand
- Mark as New
- Bookmark
- Subscribe
- Mute
- Subscribe to RSS Feed
- Permalink
- Report Inappropriate Content
Please try below code
Sum ({<territory=>}OrderSubTotal)
it will avoid territory field selection and color also will remains .
- Mark as New
- Bookmark
- Subscribe
- Mute
- Subscribe to RSS Feed
- Permalink
- Report Inappropriate Content
Hey Hans,
Try something like,
=if(OrderYear=Max({1}TOTAL $(LastYear)),lightred(),color(1))
- Mark as New
- Bookmark
- Subscribe
- Mute
- Subscribe to RSS Feed
- Permalink
- Report Inappropriate Content
Hi, try this expressions:
Sum({<Territory=,OrderYear=>} OrderSubTotal)
For the background color:
If(Only({<Territory=,OrderYear=>} OrderYear)=Max(Total {<territory=,OrderYear=>} OrderYear),LightRed(),Color(1))
- Mark as New
- Bookmark
- Subscribe
- Mute
- Subscribe to RSS Feed
- Permalink
- Report Inappropriate Content
Indeed,
Adding the 'Only' agregate function with de {1} did the trick!!!
Now I have a great example for my students where the ONLY is to be used 😉
Thanks