Unlock a world of possibilities! Login now and discover the exclusive benefits awaiting you.
- Qlik Community
- :
- All Forums
- :
- QlikView App Dev
- :
- Add count to pivot table
- Subscribe to RSS Feed
- Mark Topic as New
- Mark Topic as Read
- Float this Topic for Current User
- Bookmark
- Subscribe
- Mute
- Printer Friendly Page
- Mark as New
- Bookmark
- Subscribe
- Mute
- Subscribe to RSS Feed
- Permalink
- Report Inappropriate Content
Add count to pivot table
Hello,
I tried searching for a post in the forum that might help me but couldn't figure it out.
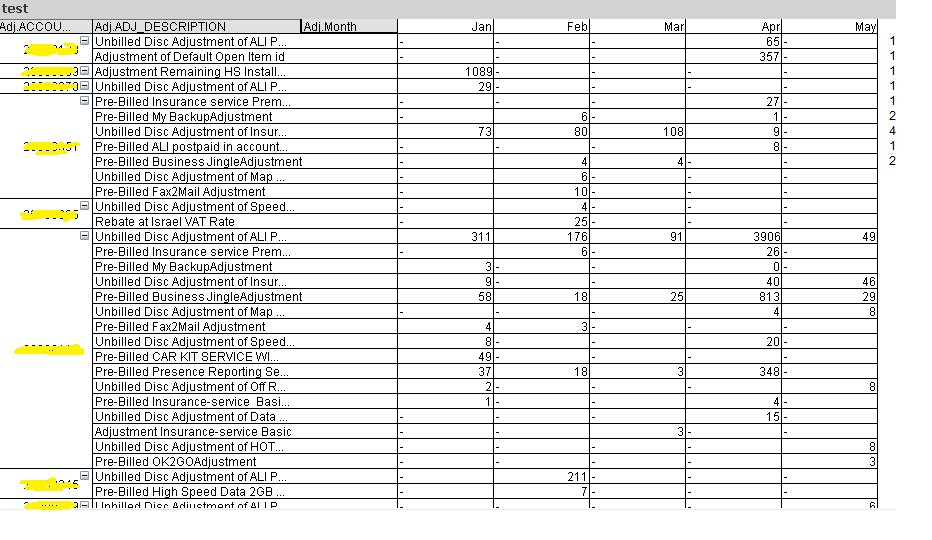
I want to create a count for my pivot table so that I can see how many refunds was given to an account for a certain reason.
For example:
I added the numbers next to each row that will count how many times adj.amount appears
Thank you for all your help
- Tags:
- qlikview_scripting
- « Previous Replies
-
- 1
- 2
- Next Replies »
- Mark as New
- Bookmark
- Subscribe
- Mute
- Subscribe to RSS Feed
- Permalink
- Report Inappropriate Content
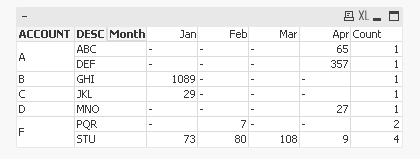
May be like this?
Script:
Table:
LOAD * Inline [
ACCOUNT, DESC, MONTH, VALUE
A, ABC, 01/04/2016, 65
A, DEF, 01/04/2016, 357
B, GHI, 01/01/2016, 1089
C, JKL, 01/01/2016, 29
D, MNO, 01/04/2016, 27
F, PQR, 01/02/2016, 6
F, PQR, 01/02/2016, 1
F, STU, 01/01/2016, 73
F, STU, 01/02/2016, 80
F, STU, 01/03/2016, 108
F, STU, 01/04/2016, 9
];
Dim:
LOAD * Inline [
Dim
1
2
];
Pivot Table
Dimensions:
ACCOUNT
DESC
=Pick(Dim, Month(MONTH), 'Count')
Expression:
=Pick(Dim, Sum(VALUE), Count(VALUE))
Sort Expression for =Pick(Dim, Month(MONTH), 'Count') dimension
=Match(Pick(Dim, Month(MONTH), 'Count'), $(=Concat(DISTINCT Chr(39) & Month(MONTH) & Chr(39), ',', Month(MONTH)) & ',' & Chr(39) & 'Count' & Chr(39)))
- Mark as New
- Bookmark
- Subscribe
- Mute
- Subscribe to RSS Feed
- Permalink
- Report Inappropriate Content
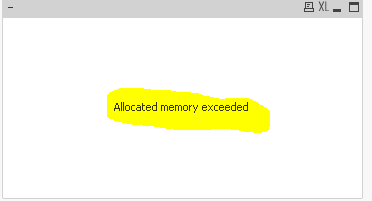
I am getting only "December" and "January".
And I don't even have December on my list.
I thought about it, I don't even need to display the count data. I just need to filter those who have a count of more than 3 payments.
- Mark as New
- Bookmark
- Subscribe
- Mute
- Subscribe to RSS Feed
- Permalink
- Report Inappropriate Content
Nice Usage of Pick. Sunny please write a blog on Pick function
- Mark as New
- Bookmark
- Subscribe
- Mute
- Subscribe to RSS Feed
- Permalink
- Report Inappropriate Content
Sunny,
When i open this file the chart showing like below...
- Mark as New
- Bookmark
- Subscribe
- Mute
- Subscribe to RSS Feed
- Permalink
- Report Inappropriate Content
You are the one you actually showed me how to use Pick in getting an additional column.
- Mark as New
- Bookmark
- Subscribe
- Mute
- Subscribe to RSS Feed
- Permalink
- Report Inappropriate Content
Try reloading and see what happens
- Mark as New
- Bookmark
- Subscribe
- Mute
- Subscribe to RSS Feed
- Permalink
- Report Inappropriate Content
Do you want me to write blog then? stalwar1
- Mark as New
- Bookmark
- Subscribe
- Mute
- Subscribe to RSS Feed
- Permalink
- Report Inappropriate Content
Ofcourse, are you waiting for an invitation?
- Mark as New
- Bookmark
- Subscribe
- Mute
- Subscribe to RSS Feed
- Permalink
- Report Inappropriate Content
I thought you could write better than me as you are frequently using in different scenarios.
- « Previous Replies
-
- 1
- 2
- Next Replies »