Unlock a world of possibilities! Login now and discover the exclusive benefits awaiting you.
- Qlik Community
- :
- All Forums
- :
- QlikView App Dev
- :
- Count values per category
- Subscribe to RSS Feed
- Mark Topic as New
- Mark Topic as Read
- Float this Topic for Current User
- Bookmark
- Subscribe
- Mute
- Printer Friendly Page
- Mark as New
- Bookmark
- Subscribe
- Mute
- Subscribe to RSS Feed
- Permalink
- Report Inappropriate Content
Count values per category
Hello,
I am quite new to Qlikview. My loading script should now be correct, but I am now having trouble displaying the correct data in my graphs.
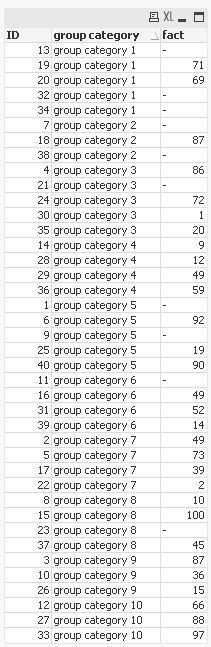
My data table consists of ID's group category indicators and of course other fields
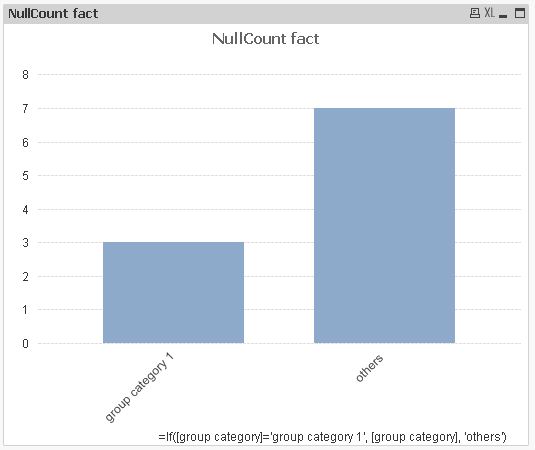
I want to have a barchart that counts the null values per category. I have done that, but I actually do not want to group by the groups as present in the category field, but I want to make new groups out of those values.
I have 9 different groups, which results in a bar chart with 9 bars, 1 per group. I actually want 1 bar for a particular group value, and one bar for all the rest. Would I need to make a new field in my script or could I write this in my bar chart dimensions?
Thanks in advance for your help.
- Tags:
- qlikview_scripting
- Mark as New
- Bookmark
- Subscribe
- Mute
- Subscribe to RSS Feed
- Permalink
- Report Inappropriate Content
Use a calculated dimension such as this:
If(Match(Groups, 'Group1', 'Group2', ...), Bar1Name, Bar2Name)
- Mark as New
- Bookmark
- Subscribe
- Mute
- Subscribe to RSS Feed
- Permalink
- Report Inappropriate Content
It would be easier to help if you post some data and maybe some picture of what you want
- Mark as New
- Bookmark
- Subscribe
- Mute
- Subscribe to RSS Feed
- Permalink
- Report Inappropriate Content
Hi,
one solution might be:

hope this helps
regards
Marco