Unlock a world of possibilities! Login now and discover the exclusive benefits awaiting you.
Announcements
Qlik Connect 2025: 3 days of full immersion in data, analytics, and AI. May 13-15 | Orlando, FL:
Learn More
- Qlik Community
- :
- All Forums
- :
- QlikView App Dev
- :
- Re: Data labels underneath vertical bars
Options
- Subscribe to RSS Feed
- Mark Topic as New
- Mark Topic as Read
- Float this Topic for Current User
- Bookmark
- Subscribe
- Mute
- Printer Friendly Page
Turn on suggestions
Auto-suggest helps you quickly narrow down your search results by suggesting possible matches as you type.
Showing results for
Anonymous
Not applicable
2016-07-19
01:58 PM
- Mark as New
- Bookmark
- Subscribe
- Mute
- Subscribe to RSS Feed
- Permalink
- Report Inappropriate Content
Data labels underneath vertical bars
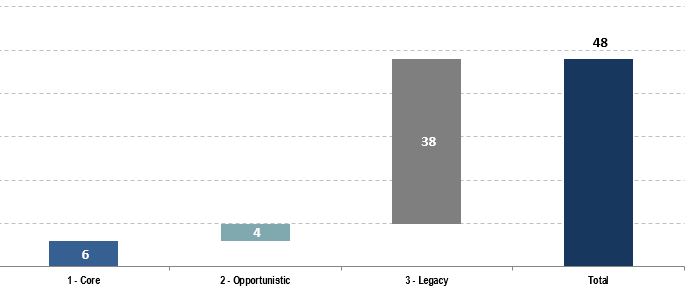
Hello everyone. I am wanting to know if it is possible to display data labels underneath vertical bars in a bar chart as pictured? Thanks.
- Tags:
- qlikview_scripting
508 Views
6 Replies
Employee
2016-07-19
02:02 PM
- Mark as New
- Bookmark
- Subscribe
- Mute
- Subscribe to RSS Feed
- Permalink
- Report Inappropriate Content
Do you have a dimension in this graph?
428 Views
MVP
2016-07-19
02:07 PM
- Mark as New
- Bookmark
- Subscribe
- Mute
- Subscribe to RSS Feed
- Permalink
- Report Inappropriate Content
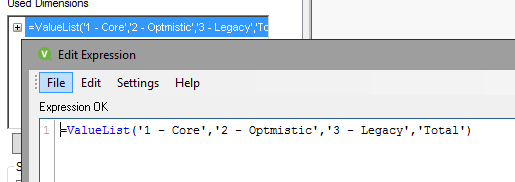
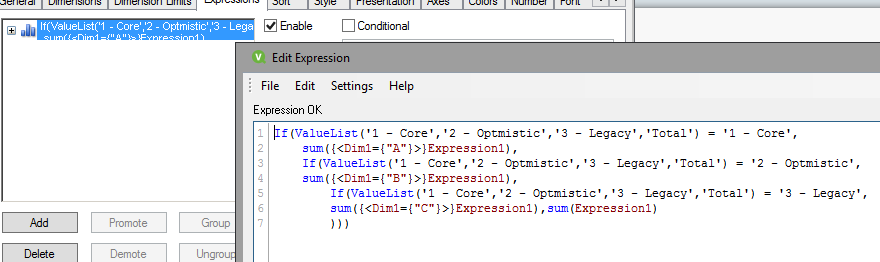
You may use valuelist function to create synthetic dimension if I correctly understand the meaning of labels in the figure. Did you mean '1-Core' etc values as labels?
428 Views
Anonymous
Not applicable
2016-07-19
02:18 PM
Author
- Mark as New
- Bookmark
- Subscribe
- Mute
- Subscribe to RSS Feed
- Permalink
- Report Inappropriate Content
yes those are the labels I am trying to reproduce
428 Views
Employee
2016-07-19
02:36 PM
- Mark as New
- Bookmark
- Subscribe
- Mute
- Subscribe to RSS Feed
- Permalink
- Report Inappropriate Content
Maybe this?
428 Views
Anonymous
Not applicable
2016-07-19
02:42 PM
Author
- Mark as New
- Bookmark
- Subscribe
- Mute
- Subscribe to RSS Feed
- Permalink
- Report Inappropriate Content
I cannot open the file - I only have the Personal Edition 
428 Views
Employee
2016-07-19
03:08 PM
- Mark as New
- Bookmark
- Subscribe
- Mute
- Subscribe to RSS Feed
- Permalink
- Report Inappropriate Content